Nov
5

What this election means to you.

This election is about your health and your family’s, because:

“Virtually every American has someone with an existing health condition in their family at any given time” 

Dan Mendelson, CEO, Avalere

(Note to readers – this isn’t a “liberal” or Democratic post, it is a factual description of reality. If you disagree, please provide citations to support assertions)

Today, you are protected because under current law (the ACA, aka “Obamacare”)  insurance companies can’t refuse to provide coverage or charge you more if you have a medical condition.  

Those protections will go away if Republicans have their way. 

According to Avalere,

Over 50% of Americans enrolled in coverage outside of the major public programs could face medical underwriting or be denied access to coverage or care without the protections for people with pre-existing conditions contained in the ACA.

Here’s why.

  1. Last year Republicans came within one vote of repealing the ACA – with NO replacement plan in place.
  2. Senate leader Mitch McConnell has said he will try to repeal ACA next year.
  3. House Republicans voted over 54 times to repeal ACA – with NO replacement plan in place.
  4. The “short-term” and “association” healthplans proposed by Republicans let insurance companies charge you anything they want if you or a family member have a pre-existing condition.
  5. These short-term and association healthplans can pick and choose what healthcare services they cover – they don’t have to cover drugs, pregnancy, or emergency room care, or anything else they bury in the fine print.
  6. Republicans are backing a lawsuit that would overturn the ACA in its entirety – and many of the Republicans behind the suit are running for Congress.

If you or someone in your family has had:

  • heart disease, high cholesterol, or high blood pressure
  • anxiety or depression or any other mental health condition
  • obesity
  • diabetes
  • cancer
  • or is pregnant,

your healthcare is at risk.

I have no problem whatsoever with principled Republicans – or anyone else – wanting to overturn the ACA. I have a big problem with anyone who’s lying about what they are doing.


Fact is the GOP has tried over 50 times to let insurance companies refuse to cover your pre-existing conditions, they are pushing a suit that would do the same thing, their bills in Congress will let insurance companies charge you anything they want, yet they are claiming they will protect you.

That’s just a lie.

What does this mean for you?

Do you want insurance to cover your pre-existing medical conditions? 


Oct
31

Workers’ comp claims, OSHA reportables, and why both are dropping

Well, some posts get a life of their own, and so it is with this discussion of claims frequency and claims counts. After much discussion with colleagues and several back-and-forth emails with WCRI CEO John Ruser PhD about the correlation of OSHA recordable data and work comp claims and why both are declining, I decided the best way to get this to you, dear reader, is via an interview. So, read on.

MCM – I believe that you were responsible for the BLS OSHA-recordable injury data for years. What are a couple key points readers should know about the OSHA-recordable reports?

Dr Ruser – Yes, I was BLS Assistant Commissioner for Occupational Safety and Health Statistics for over 5 years and was a researcher of the BLS OSHA data for many years before that.

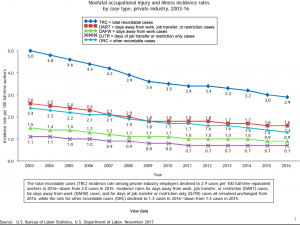
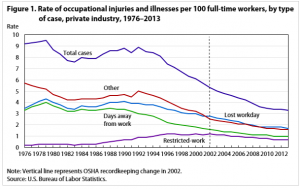
While there has been some controversy about the completeness of reporting in the OSHA recordkeeping system (see below), the BLS OSHA-recordable injury rate data are extremely valuable for several reasons.  They are very detailed by State, by industry, by establishment size and by worker characteristics, so that are an important benchmarking tool for risk managers and others seeking to compare their company’s injury rates against their peers.  From the perspective of focusing injury risk reduction efforts, they are important in identifying those groups of workers at higher risk of injury and they are used by OSHA to identify high-risk industries for inspections.  And, with their long relatively-consistent time series and detail, they are a valuable tool for researchers seeking to understand factors that contribute to workplace injuries.

MCM – Where does BLS get the data for the OSHA-recordable reports?

Dr Ruser – BLS’s estimates of OSHA-recordable injuries are based on a very large annual survey of about a quarter-million establishments (that is, specific locations of a company or organization) called the Survey of Occupational Injuries and Illnesses (SOII).  The SOII contains employer-reported data drawn from the OSHA logs that establishments keep throughout the year.  SOII covers non-fatal occupational injuries and those illnesses that can be directly linked to a workplace.  A separate BLS program, the Census of Fatal Occupational Injuries, uses multiple data sources, such as death certificates, OSHA reports and many other sources, to track workplace deaths due to injury.

MCM – there’s been questions about the decline in reportables over the years. Can you comment on these questions?

Dr Ruser – Some skeptics of the declines in the BLS OSHA-recordable injury rates attribute these declines to changes in OSHA-recordkeeping rules and practices or tightening in WC compensability rules, meaning the declines in injury rates are at least in part an artifact of reporting.  External research supported by BLS and other non-BLS-supported research does suggest that the number of injuries captured in SOII undercounts the true number of OSHA-recordable injuries.  (BLS has a very complete webpage on SOII data quality research that you can access here: https://www.bls.gov/iif/soii-bibliography.htm)

But, while the numbers (levels) of injuries and claims may be undercounted, the issue for the observed declines (trends) in injuries (and WC claims) is whether underreporting has grown.  There is little direct research on this.  A study by Washington State comparing SOII data to WC claims found that during the first five years of the study period (2002 – 2006), underreporting decreased, while it increased from 2007 to 2011.  Importantly, the Washington State researchers concluded that the total estimated actual number of SOII-eligible WC time loss injuries decreased over the ten year span, meaning there were real declines in injuries (and some underreporting too).

The Washington State study was excellent, but it focused on one state and a relatively short time span, which included a great recession during the second half of the study period when underreporting was identified.   Another approach to validating the time trends is to compare to other data that should not be susceptible to the concerns raised about reporting.

MCM – what analyses did you do to explore that issue?

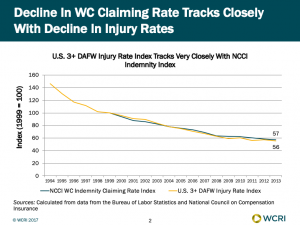
Dr Ruser – I compared the SOII data with data from other sources.  First, I looked at how the US injury rate for 3 or more days away from work tracks with the NCCI indemnity claiming rate.  The declines in these two data series track extremely closely.  So, while the OSHA recordkeeping system is technically independent of workers’ compensation, the BLS injury data and the NCCI claims data are telling the same story and the BLS data can be used to try to identify factors associated with the decline in the NCCI WC claiming rate.

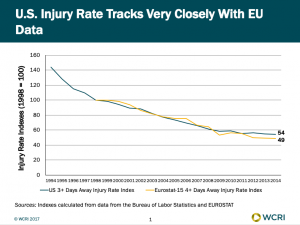
Regarding whether the BLS injury rate decline is real, I created an index of the OSHA-recordable case rate for cases with 3 or more days away from work and lined it up with a similar index for 15 EU countries for injuries with 4 or more days away from work (the series most comparable to the US data).  The chart that is attached shows how similar the trends are in the US and in the EU.  The index was set to 100 for injury rate values in 1998 and the other values in the chart are injury rates relative to 1998.  As of 2014, the US injury rate was 54 percent of its value in 1998, while the EU injury rate in 2014 was 49 percent of its value in 1998.

MCM – what does this mean (for our readers)?:

Dr Ruser- The remarkably similar trends in the US and EU data suggest that we need to look beyond US-specific explanations (such as OSHA-recordkeeping rules or WC compensability rules) to understand what is responsible for the long-run aggregate declines in injury rates and WC claims rates.  While there may be some changes in reporting at least over part of the past quarter century, the good news, I believe, is that there has been a remarkable improvement in safety and this improvement is seen in most industries and in many developed countries.


Oct
30

Workers’ comp claim frequency – part 2

Two messages from colleagues about yesterday’s claim frequency post add important nuance and depth to the issue.

First, thanks to WCRI CEO John Ruser PhD for his note with more current information on recordable data.

These data are critical as they are the only source I know of that records the actual injury numbers, or counts of occupational injuries and illnesses. Almost all other sources document percentages based on premium dollars or FTEs. While those are useful, service providers really want to know the actual number.

Ruser [emphasis added]

BLS has data through 2016 on its website (the chart book is easiest to digest and can be found here: https://www.bls.gov/iif/osch0060.pdf)  The data show continued decline in OSHA-recordable rates through 2016, particularly among “other recordable cases.”  BLS will release updated non-fatal injury data through 2017 on November 8.

I agree with you that credible research on why rates are declining is lacking.  There simply aren’t good data to tease out the possible factors.  Interestingly, shifts in hours worked away from high hazard industries does not explain the long decline in rates.  The vast majority of industries are experiencing declines.  I documented this in a paper I wrote for the American Journal of Industrial Medicine. 

I’d emphasize John’s comment on high hazard industries. I’ve opined that fewer injuries in heavy manufacturing and construction were a likely contributor to the reductions in trend; thanks to John for correcting my error.

Next, from a former state workers’ comp director. [emphasis added]

as I look at chart provided in your blog today it took me back to the early days after the reform of XXXX. As can clearly be seen in the chart starting in 1992 the trend started down and has continued ever since.  A lot of risk managers and safety staff took a lot of credit for those numbers as proof that they were doing a good job. I remember at the time thinking boy this looks really good but surely there is another explanation other than the [legislated] reform and all that we were doing in safety and I was right. Even after the… emphasis on safety [was reduced]…the number continued to go down. As I look back I was just in the right place at the right time.  But when good things happen that can not be explained we tend to take credit for them

This expert’s view is well worth repeating, perhaps best said by Tacitus:

victory is claimed by all, failure to one alone

What does this mean for you?

Claim counts are dropping – and will continue to do so. There is little “white space”, so growth for claims service companies will come from taking business from competitors.


Oct
29

Workers’ comp claim counts are down…right?

A recently-released analysis of workers’ comp claim frequency tells us what we’ve known for years – the percentage of workers that gets hurt on the job has been and continues to drop.

Yet one major insurer indicates there are warning signs that frequency may be ticking back up, albeit in a tightly defined sector of the economy. More on that below.

There are many theories about why frequency has declined for decades – more automation, more emphasis on safety programs and loss control, less heavy industry here in the US, low investment in infrastructure leading to fewer jobs doing heavy construction. Many theories, but I have yet to see any credible research into exactly why frequency is declining.

This is one of those data points that is enormously important, yet it doesn’t get enough attention. So, here’s the skinny.

Claim frequency is a percentage  – the number of injuries compared to premium dollars or FTE workers. Therefore the number of work comp claims is driven by the denominator; if premium or employment goes up, that can offset a decline in the percentage of claims.

But employment is about maxed out, so any changes in the percentage of claims will closely mirror the actual number of claims.

Another way to track the number of claims is to compare it to Federal data on the actual number of occupational injuries and illnesses. The graph below shows that the actual number of claims per 100 workers…

You’ve already figured out that the graph ends in 2013…so what about the intervening years?  Fortunately NCCI provides ongoing research into just that here.  When you dig deeper, we learn that total frequency dropped almost one-fifth from 2011 to 2016, led by office and clerical job classes.

As we learned at AIS in May, NCCI estimated frequency declined another 6 percent in 2017; the average decline over the last two decades has been 3.7 percent.

But.

Last week the Hartford announced it is seeing early indications of an uptick in claims volume. Chairman and CEO Chris Swift said [emphasis added]:

“workers’ compensation 2018 frequency trends are elevated from expectation…

our frequency in small commercial and middle market has turned positive this year. Based on our business and economic analysis, we view this trend as broader than just our book of business.

Many businesses are struggling to find qualified employees and beginning to add more new workers to their payroll, generally increasing the risk of workplace injury versus what it would have been say a year or two ago.

Additionally, the tightening labor market produces more hours work for employee often resulting in fatigue and less training time compounding the risk of injury for the less experience workers.

Our uptick in frequency change has been moderate turning positive on a rolling 12-month basis. The actual frequency levels are now comparable to what we experienced in 2016 which is a very manageable shift in a book of business as large as ours.

The frequency increase is more pronounced among less tenured employees and it can be several times that of experienced workers.”

Notably, the Hartford attributed a 3.5% increase in Accident year combined ratio for its middle market business to this increase in frequency.

Couple of key points about this.

  1.  The Hartford is the largest national seller of work com policies to small employers, and thus has the broadest lens.
  2. As a major writer, it also has lots of dollars to invest in business analytics – so it knows more faster than many insurers do. This from Hartford President Dough Elliott:

we have now installed a new claim platform over our 5,000 desk throughout claim. And the ability to access what I’ll call structured data and to slice and dice and be on top of it and to look at your metrics and watch your trends is much advanced from where we were five years ago. And so we have monthly and weekly discussions but we’re sitting on top of trends that candidly five years ago were very manual in nature to try to get our arms around and they were slower than we’d like to them to be.

What does this mean for you?

  • This is not unexpected; we are close to max employment; small employers are desperate for workers and don’t have the time/expertise/resources to screen/train/protect those workers.
  • Time to look at your data – closely.
  • And likely time to dust off those underwriting, safety, and loss prevention manuals.


Oct
26

Tulips, winter, and value – the world of work comp services investments

Over the last decade I’ve worked with over 30 investment firms on perhaps 60 deals.  One question I almost always get is:

Would you buy this company?

And a related question:

What would you pay for this company?

For years I tried to answer those questions, factoring in the company’s service reputation; the uniqueness of it’s services and/or business model; experience of management; value delivered to it’s customers; and a bunch of other stuff.

I finally realized those criteria often had little to do with the “value” defined by most investment firms. And much more to do with Dutch Tulips.

To most private equity firms, “value” is what can they sell the company for in a few years. One would think the selling price would be driven in large part by those other criteria; in many cases, one would be wrong.

Recent valuations of some work comp service companies are – in my view – completely disconnected from the actual value inherent in these companies – actual value defined as the value they bring to their customers and the potential for those companies to grow and prosper.

In fact, what seems more important than actual value is the ability of the seller to craft a story about how the company is going to grow, it’s unique business model, it’s scalability and potential to be a platform to which other acquisitions can be added. This is typically future-forecasting, theoretical stuff based on assumptions thin enough to blow away in the slightest of headwinds.

But more often than not, enough potential investors buy into the story to create a bit of a feeding frenzy, until one agrees to pay way more than that company’s actual value.

I’m far from an investment expert – one look at my personal portfolio will prove that – and in no way am I saying the brilliant folks at private equity firms don’t know what they are doing.  Far from it – these people are doing exactly what they are supposed to do – make gobs of money for their investors.

What I am saying is these firms are rewarded when they sell the companies they bought for a lot more than they paid. That works out really well – if they can find someone to buy it at a hefty markup. At some point the next owner – or the one after that – finds out that the actual value of that company is far less than they thought.

It’s also known as the Greater Fool Theory, or the Dutch Tulip problem. You know the asset isn’t worth what you’re paying, but you’re sure you can find someone else who will pay more than you did.

What does this mean for you?

Beware of tulips. They flourish until winter comes. And winter ALWAYS comes.


Oct
24

This election is about your pre-existing medical condition

Will you be able to afford health insurance, and will that insurance cover your pre-existing medical conditions? For most, that’s the biggest issue in the upcoming election.

Congressional Republicans are planning to pass legislation that allows insurers to:

a) stop paying for your pre-ex conditions; and/or

b) charge you anything they want for your health insurance – which does the same thing

Ignore their claims that they will protect you, because:

What they do have is bait-and-switch.

Republican candidates are pushing legislation that would “force insurers to cover all pre-existing conditions” – but they could charge you anything they want for that insurance. 

If you just won the $1.4 billion lotto, you’re all set. If not, you’re screwed.

What does this mean for you?

If you or a family member have a pre-existing condition, this election is about you.

If you aren’t sure, here’s a list.

And if you think you can hide your condition, you can’t. 


Oct
19

Research (and other important stuff) Roundup

It’s that time again – WCRI has released it’s latest series of CompScope reports, the most detailed and thorough review of all things work comp medical in 18 key states. If you are an investment analyst, industry tracker, or involved in planning for a TPA, state fund, insurer or large employer, get yourself over to WCRI and get those reports!

If you want to understand what Medicare for All really is, how it might work, and what it means to you, read KFF’s summary review. There are 8 (!) proposals now making the rounds, and I’m betting your healthcare will come from some version of universal coverage within the decade.

Excellent piece by Roberto Ceniceros on premium fraud and its impact on employers and insurers. I’ve got to give credit once more to Matt Capece of the United Brotherhood of Carpenters – he’s been a major force exposing premium and payroll fraud all across the country. For his efforts, IAIABC gave Matt its Samuel Gompers Award. And kudos to Roberto for his in-depth reporting on a critical issue.

NCCI continues to up its game, making research accessible and relevant. Medical marijuana, opioid legislation, air ambulance regs – it’s all here.

Our penultimate piece is a bit more intel on rideshare and rural America – well worth a read if you’re involved in this narrow-but-deep slice of the work comp services world.

Finally, as it’s election season we need to hold those political candidates accountable: Andrew Sprung’s dissection of candidate Bob Hugin’s dissembling on the dismantling of the ACA is just what voters should be asking.

And, from the “coolest/dumbest thing I’ve seen all week” is this. Wondering if this is the answer to speedy ridesharing on the Russian steppes. Who wouldn’t want a jet engine in their Uber?

Hat tip to the Drive!


Oct
18

Halloween HealthWonkReview!

Okay, I’m a bit early on the pumpkin-and-costume thing, but time is going by so damn fast I want to be early for once.

It’s also open enrollment time! that joyful event where we all get completely confused, baffled beyond belief, our minds all-a-boggled by all the tiny print on the screen describing in excruciatingly minute detail really important nuances in health benefit design that, if we ignore, will cause us to go bankrupt and die. Fear Not – Louise is here in her SuperWoman costume, typing madly away to bring you all you need to know about individual market enrollment – and in English too!

There’s been a lot of chatter about simplifying all this stuff, with much of it about Medicare for All. My contribution this week unpacks the argument that MFA would somehow harm Medicare. Hint – MFA is not the boogyman it’s made out to be.

Andrew Sprung’s found out that Bob Hugin, Republican candidate for the Senate seat held by Bob Menendez in NJ may well be hiding his real views on healthcare – but no one is asking. Andrew’s not afraid to ask…What’s behind the curtain, Mr Hugin?

Hank Stern over at Insureblog.net doesn’t like the HMO-only plans offered to his clients in the Buckeye State; Hank sees the evil hand of Obamacare at work, limiting his clients’ choices.

Our favorite healthcare economist, Jason Shafrin, has been looking into the costs of mental health that go beyond medical care. He’s also done a lot of research into medication adherence. And I can’t find any meme that works for this entry…darn it.


If you don a nursing costume, you may need to add a back brace. Nursing assistants get more back injuries than any other occupation. That’s the scary news from Tom Lynch at Workers’ Comp Insider.

The estimable David Williams is on a search to uncover a deep mystery – what happened to “Consumer Directed Health Plans”??? Join David as  he finds this to be a conundrum wrapped in an enigma; were they ever REALLY “consumer” directed?

Leaving my poor attempts at humor behind, Ranit Mishori MD MHS asks some very pointed questions about political determinants of health, determinants such as the for-profit motive and prioritizing religious beliefs over science.

Out long-term colleague Roy Poses MD FACP has been focusing on this as long as HWR has been around (15 years and counting). Roy’s learned big health care corporations, particularly pharma, biotech, device, and health insurance companies, provide significant sources of funding to dark money organizations.  It appears nearly all such money from health care organizations supports right- wing/ Republican/ pro-President Trump activities.

What happened to putting patients above all?

Thanks for reading, and thanks for writing contributors!


Oct
17

Who’s investing in work comp services now?

Several years ago it was smaller private equity firms who bought companies for $75 – $200 million, built them up, and sold them off. Then it was the bigger PE firms who put together a couple of these and hoped to sell them for more than they paid – and were mostly successful.

One of the first deals was way back ten years ago – and what’s transpired with that deal is emblematic of the evolution of the industry.

PMSI was sold by owner Amerisource Bergen after the PBM industry’s founding company just kind of melted away. HIG Capital picked it up for  about $50 million, and quickly brought in one of the most talented managers I’ve ever had the honor of knowing – Eileen Auen. Greatly aided by a major cash infusion, Eileen and her team turned the all-but-buried company around. HIG profited  handsomely when it was sold to Stone River and merged with Progressive Medical, a deal that was backed by Kelso.

The new company, renamed Helios, grew and was eventually sold to OptumRx, a division of giant health insurer UnitedHealthcare.

Optum is what is known as a “strategic” buyer. Strategics are investors that buy assets to add to its existing operation, ideally leveraging existing infrastructure, customers, systems, and suppliers. The result is infrastructure costs (and ideally supply costs) are reduced and revenues increased.

So, we have strategics such as Optum, Mitchell (see acquisitions of Pharmacy Benefit Managers), and Paradigm buying companies that somehow make the whole greater than the sum of the parts.

I’d note that some of these transactions seem a bit of a stretch, but, hey, I’m not the one who went to Harvard Business School, so what do I know.

The financial investors are the other entities still in the game.  Of late, it’s been the giants – Carlyle, Stone Point, KKR – investment firms with billions in ready cash, deep knowledge of the business, and the savvy needed to pick out management teams and business models that will flourish in what is a declining industry – workers’ comp.

We haven’t seen much activity on the small end of the deal world – except for Adva-net and a couple smaller transactions things have been pretty dull of late.  While there are a bunch of smaller companies in various geographic and/or service niches, there’s been precious little trading activity over the last couple of years (with a couple exceptions)

There’s one more investor type that’s getting more active these days – distressed asset investors. Their strategy is to find companies that aren’t doing well financially and buy them – sometimes out of bankruptcy or just before they tank.

I’d expect we’ll see more of the distressed asset folks making the rounds in Las Vegas in six weeks, finding out what’s up and who’s making it and who isn’t.

What does this mean for you?

The work comp service industry is getting awfully mature.


Oct
15

It’s complicated.

Let’s have a reasoned and fact-based discussion of why I believe the trade war is bad for your business and your job.

At its most basic level, the issue is this – there are few simple answers to big problems. Sure, there are soundbites and memes that may make you feel good… but like that second helping of dessert, it tastes great but leaves you feeling bloated and unhappy.

For example – “Trade wars are good and easy to win.”

If you want to get a country to change it’s industrial policy or actions, a trade war is certainly one option.

Some think the tariffs on China were an appropriate way to get its attention. And no doubt, the import duties on steel and aluminum and manufactured goods got noticed.

But tariffs are a two way street; the Administration’s actions resulted in China imposing retaliatory taxes on US exports of coal, farm goods, motorcycles, asphalt, Vaseline, cars, meat, airplanes and a bunch of other stuff.

It’s not just China – The tariffs on Canadian newsprint were crushing US newspapers, many of which have been barely staying afloat. The tariffs were finally overturned after hundreds of jobs were lost.

Farmers aren’t as fortunate; there are hundreds of millions of bushels of soybeans piling up – with no buyers in sight. Farmers looking to store this grain can’t afford new silos, as the price of steel has gone up 25%.

And jobs are at stake.  From Forbes:

“The tariffs, quotas and retaliation would increase the annual level of U.S. steel employment and non-ferrous metals (primarily aluminum) employment by 26,280 jobs over the first one-three years, but reduce net employment by 432,747 jobs throughout the rest of the economy, for a total net loss of 400,445 jobs.” [emphasis added] The analysis found, “16 jobs would be lost for every steel/aluminum job gained.”

It’s not just employment; tariffs don’t operate in a vacuum, but are one tool governments have to influence other countries. In fact, there are real national security issues in play here.

One is North Korea; China has more influence on North Korea than every other country combined, so when we anger the Chinese, they get a lot less interested in enforcing arms and energy embargoes on the rogue state of North Korea.

Then there’s China’s illegal building of naval bases in the South China Sea, which is a shipping bottleneck; over a quarter of the world’s shipping transits the Sea. It is also home to huge reserves of carbon-based energy deposits. The pace of construction has greatly accelerated of late and the number of troubling incidents in the area has increased – a Chinese naval vessel almost collided with a US destroyer a few weeks ago.

Okay, you say, we’ll get this resolved and all will go back to the way it was, farmers and pork producers and Boeing and coal miners will be fine.

Not so fast.

In reality, China – and other countries affected by our tariffs – have already shifted their purchasing to other countries. Brazil and Argentina are huge grain and meat producing countries, and they are benefiting greatly from the trade war.

US farmers are getting hammeredUS wheat exports globally have plummeted by 21 per cent in just the first half of 2018. This means fewer dollars for farm equipment, fencing, fuel, fertilizer.

And farmers are the canary in the coal mine; this trade war is going to have lasting and serious repercussions for our economy and each one of us; the longer it goes on, the worse it will get.

What does this mean for you?

When you’re stuck in a hole, the first thing to do is stop digging. 

Why this affects you – a recession hurts all of us – lowering employment, increasing healthcare costs, increasing work comp claims.

But long-term losses of markets causes long-term damage to entire economic sectors. That’s the real issue here.