OSHA’s long-awaited proposed heat rule is out.
There are two heat index thresholds – one at 80 and 90 degrees F based on temperatures in the shade (as we all know it can be a LOT hotter in direct sunlight.)
At 80F, employers would be required to:
- provide drinking water,
- provide break areas that workers can use as needed, and
- have a plan for new and returning workers to adjust to the heat by gradually increasing their workload.
At 90F employers would have to:
- monitor workers for signs of heat illness,
- provide mandatory 15 minute rest breaks every 2 hours,
- check on people working alone ever few hours, and
- issue a hazard alert warning worker to stay hydrated.
Workers in “sedentary” jobs, those working inside where temps are kept below 80F, emergency response workers and remote employees are exempt, as are public employees including school workers.
From Bloomberg Law:
Once published in the Federal Register, the proposal will go through a public comment period and further White House review before it’s finalized—a process that could continue into 2025.
The timing is fortuitous…at least 45 million of us will be living with temps at or above 100 degrees F this week…including thousands of workers in California’s Central Valley and eastern Louisiana.

The EPA will release a report today indicating the heat wave season is a month and a half longer today than it was in the 1960s, and the average heat wave is a third longer.
What does this mean for you?
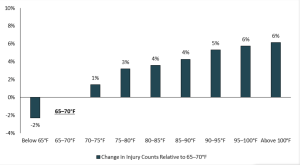
Very much needed…more workers are dying of heat-related causes than ever; human-caused climate change is speeding up; and injury totals climb along with temperatures.