Jun
7

Work comp provider networks and access to care

Of late there’s been “confusion” in several quarters about the impact of provider networks/PPOs/specialty networks on access to care and outcomes.

These uninformed or willfully ignorant folks claim all manner of bad stuff is due to workers’ comp provider networks – without an iota of evidence to support those assertions.

Let’s pick on the Golden State…

Let’s be clear…actual research shows:

there is NO significant difference in access to care for patients treated within or outside a Medical Provider Network.

This from CWCI’s report

Similarly, there was no significant difference in distance from the patient to provider between MPN and non-MPN patients.

Quoting CWCI…

The latest proximity to care findings also track with results of CWCI’s April 2021 research which found that 99 percent of claims in which treatment was rendered by an MPN provider, and 98 percent of non-MPN claims met the state’s access standards.

What does this mean for you?

Do NOT give any credence to statements similar to: “of course, paying providers less than fee schedule affects access to care” UNLESS they are backed up by real research and not built on a pile of unfounded and unsupported assumptions.


Jun
6

the basics of price and spend in work comp medical…

Basics here folks…

Facility costs soak up 2 out of every 5 dollars of work comp medical spend.

“Physician” costs take up another 2 bucks…however that is misleading.

In NCCI-speak, “physician” is a catch-all for most practitioners…MDs, DOs, PTs, chiropractors, PAs…and, the “physician” fee schedule in most states doesn’t apply to things like physical medicine (PM).

Historically PM accounts for right around one of every 6 work comp medical dollars (yes that is a very solid number based on a ton of work I’ve done), although like everything in work comp it varies somewhat by state.

Then there’s drugs, dx imaging, DME, etc.

Drugs account for less than 10% of spend, a figure that has been declining for years thanks to much better clinical management of pharmacy  – mostly by PBMs – more generic usage, a massive decrease in overuse of opioids, fewer new brand drugs used for MSK injuries, and declining fee schedules.

Risk and Insurance’s Annemarie Mannion penned an excellent explanation of how Medicare reimbursement affects work comp fee schedules.  Read her piece and save it in your reference files…you will need it in the future.

Finally, network penetration does have some effect on prices paid…although that impact has declined over the last few years as providers have figured out that when it comes to negotiating with health systems, workers’ comp is pretty much clueless.  Here’s a synopsis of network impact from a post a couple years back.


Jun
1

that giant sucking sound…v3

is hospitals hoovering dollars out of employers, work comp insurers, and taxpayers’ wallets.

(sorry all…due to a bug in WordPress some of you may be getting this again)

WCRI’s latest research report on hospital costs is a must-read for anyone involved in work comp claims, medical management and actuarial issues. Kudos to Drs Olesya Fomenko and Rebecca Yang for their excellent work. 

The study focuses mostly on how payments for outpatient surgery vary across the different types of fee schedules (no fee schedule vs fixed amount vs cost to charge ratio vs percent of charges…)…and how those payments have changed over time.

But there are several other issues that I’d argue are more impactful.

  • It’s not so much the type of fee schedule as other factors…
    • there’s a LOT of variation between states with the same type of FS
    • failing to expand Medicaid is a big problem for hospitals
  • Basing fee schedules on percent of charges is a really bad idea…
    • states with %-of-charges FS had – by FAR – the highest costs, averaging more than 3 times what Medicare pays. (Medicare reimbursement is slightly above break-even for hospitals)
    • `hospitals easily game the “fee schedule” by jacking up list prices
    • 2 of the three states with the largest increases in hospital payments had FS based on %-of-charges
  •  States with NO fee schedules were not quite as bad – averaging “only” 225% of Medicare
  • Clearly network arrangements have failed miserably. 

What does this mean for you?

Actuaries…check the inflation trend to predict where costs will be in the future

Medical management folks…dig into your data to identify the worst offenders, and direct care AWAY from them.  Hint – HCA facilities are usually among the worse offenders.

Bill reviewers – STOP relying on network discounts and start getting  LOT smarter about dealing with facilities.


May
26

US healthcare quality is poor because…

Consumers don’t care.

Yesterday we dove into the disconnect between patient satisfaction (my nurse was sooo nice and my room…wow!) and quality of care (how likely was I to die).

Today, we focus on how this affects our healthcare. Or, as the researchers put it;

In an era of management by satisfaction survey, how does hospital competition shape the kind of medical services offered to patients? 

Leaving out the coefficients, standardized deviations, null estimates and other researchers’ esoterica, we find:

Local competition among hospitals leads to higher patient satisfaction, but lower medical quality. 

Yep, because we consumers value quiet rooms and nice nurses more than surviving an operation, health care facilities seem to focus more on quietness and niceness than on, you know, patients actually surviving.

And that’s because hospitals are competing desperately for private-pay patients, the ones insured by employers that pay three times more than Medicare. As the authors put it;

as a business strategy, investing in hospitality and hotel amenities offers a much higher return than medical quality. 

this research speaks to broad concerns about the unintended consequences of marketization…Hospitals have traditionally been conceived as an essential service to a community, but are becoming more like products in a consumer marketplace.

Those working in hospitals are increasingly expected to focus on the pursuit of customer satisfaction.

The day-to-day institutional question is shifting from “will this improve patient health?” to “will this raise satisfaction scores?” 

What does this mean for you?

Depends… life > comfort?


May
25

Patient satisfaction ≠ Quality of care

Health care quality is a huge issue in the US; despite claims that we have the best healthcare in the world, reality is far different.

Why?  I’d argue its because healthcare consumer behavior drives our for-profit system.

What makes patients happy is completely unrelated to the actual quality of medical care they receive – or how likely they are to die.

Research article is here.

the horizontal axis indicates hospital performance by deciles for each category…note patient satisfaction doesn’t vary by hospital mortality and varies just a little by medical quality, but varies a LOT by nurse communication.

The effect of nurse communication on patient satisfaction is four times larger than the effect of the hospital’s mortality rate. Yup, as long as the nurse smiles, is responsive and nice, we’re satisfied. Never mind if we’re a lot more likely to die.

Another oft-measured factor, the quietness of the rooms, has a 40% larger effect on patient satisfaction than medical quality.

This is because hospitals provide two separate and distinct kinds of services  – the technical delivery of medical care and “room and board-related” services. Patients are much better at observing and rating the “hospitality” part of their hospital stay than the medical care they get.

To quote the authors;

Hospitality is the fast track to customer satisfaction in medicine. 

What does this mean for you?

Customer satisfaction is the fast track to profits… not to good medical care.


May
23

Work comp drugs – Three things

Workers’ comp news…

After a long and litigious delay, myMatrixx has been awarded the contract to manage pharmacy benefits for the Coal and Energy programs run by the Federal Department of Labor’s Office of Workers’ Compensation Programs (OWCP). Details of the case – which involved a protest by rival PBM Optum – are here.

That’s the good news (the Feds should have had a PBM managing these programs years ago).

Now, the bad news.

The press continues to dive into the audit of the other OWCP program – the one that provides workers’ comp to all Federal employees (FECA). [audit report is free for download here]

The latest is from Leslie Small of AIS Health. [available at no cost via free trial subscription].

From Ms. Small’s piece:

  • “OWCP has been doing a poor job of both controlling the FECA programs spending on prescription drugs and implementing its own policies to ensure that prescriptions are being appropriately dispensed, said the OIG report.”
  • OWCP published a bulletin in 2011 that forbid reimbursement for fast-acting fentanyl prescriptions unless claimants had been diagnosed with a certain type of cancer…during the audit period…98.7% of the fast-acting fentanyl scripts that OWCP [and taxpayers] paid for “went to claimants without evidence of one of hte eligible cancer diagnoses” 
  • Even more troubling – if that’s possible – OWCP did not institute controls to mitigate opioid usage until the end of 2016, years after many commercial insurers, third-rate administrators, and large employees had done so…”

Here’s hoping this much-needed attention results in even-more-needed improvements.(my opinion only)

Drug costs in California are getting well deserved attention again; CWCI’s research identified 9 drugs – 3 each opioids, dermatologicals and antidepressants – that account for a significant percentage of total drug spend. CWCI members can get the full report at no cost; it’s $18 for others.

Briefly, branded anti-depressants, tapentadol/Nucynta, and the three anti-depressants make up a small percentage of scripts but a big percentage of dollars.

Of course, in the vast majority of cases the dermos are just BS drugs that should never be allowed…

What does this mean for you?

Don’t sleep on pharmacy...sure costs are down, but it still has a major influence on recovery, RTW, and claim closure.


May
10

Work comp is rocking.

That’s the only conclusion one could draw from this year’s NCCI State of the Line report. 

Very profitable despite declining premium rates, eye-watering pre-tax operating gains, and eight straight years of very solid profits…the corks must have been popping down in Orlando.

(wasn’t able to make the event this year…boys’ annual mountain biking trip kinda took precedence…thanks to NCCI’s Cristine Pike for keeping me in the loop!)

Details..

  • private carriers’ pretax operating gain of 25% – within an eyelash of the record year of 2018
  • loss ratio of 43%…43%!!! – the lowest in two decades.
  • combined ratio was 84%
  • lost time claim frequency dropped 4 points
  • $17 billion in excess reserves

This last is most striking as it is incontrovertible proof that premium rates are still far too high.

There are a bunch of implications that we’ll dive into in the next few days, but let’s start with the biggest one:

Why are employers and taxpayers still paying way too much for worker’s comp?

I predicted this back in 2019 – in a word, opioids.


Apr
26

Drugs and workers’ comp, part 1

Download the latest Survey of Prescription Drug Management in Workers’ Comp here

Key takeaways

  1. Total drug spend in workers’ comp was likely around $2.9 billion in 2021.
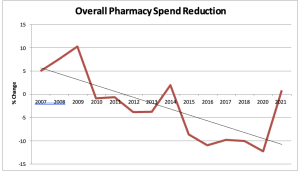
  2. The multi-year decline in drug spend seems to have flattened out; across all 31 respondents spend ticked up 0.82%.
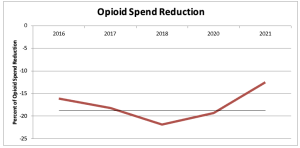
  3. Opioid spend continued to drop, with 2021 figures showing a 12.5% drop over the previous year. Opioids represented 13.4% of all respondents’ pharmacy, the lowest figure in the two-decade history of this survey.
  4. Legacy opioid patients continue to be a challenge for many payers; most have adopted a “we’ll do whatever might help” approach to these patients.
  5. Physician dispensing is once again rearing its ugly head with respondents rating it the single biggest problem in workers’ compensation pharmacy after a multi-year hiatus from that august position.
  6. Payers continue to highly value PBM customer service; myMatrixx continues to lead the industry in that key category.

Media – if you’d like a much more detailed version of the report (which respondents receive) please leave a request in the comment section.


Apr
10


WCRI is out with its latest inventory of state regulations re prescription drug management. This is a must-have for claims execs, managed care leaders, medical directors and risk managers…pricing, utilization review, opioid management, formularies and PBM regs are all covered.

Revenue Cycle Management – aka hoovering mounds of cash from workers’ comp payers – is the focus of a “white paper” targeting hospital and health system execs. If you want to know the hooverers’ playbook, sign up and be prepared to be amazed.

A closely-related item…

From the wonderful folks at Kaiser Family Foundation comes the shocking news that facility fees are driving ER costs to the moon. As most of you (hopefully) know, regulations allow any service delivered at a facility to uncharge a facility fee. It is not hyperbole to note hospitals are wildly abusing this, taking on facility fees to services provided at

      • remote clinics
      • physician offices
      • even telemedicine visits

oh, btw, many hospitals are STILL not complying with Federal requirements to post prices…

Finally, from HBR comes this excellent advisory on how not to anger/frustrate/alienate customers…something many worker’s comp entities seem surprisingly good at. (We are NOT looking at you, LWCC…your work on patient engagement is really good stuff)

All too common is the industry’s maniacal prioritization of efficiency over everything else. From HBR:

when focusing on efficiency, many companies overlook the emotional aspect of the customer experience — how customers feel when interacting with the business.

The piece focuses on consumers – which every injured worker is.

What does this mean for you?

Tired of being hospitals’ piggy bank?… then understand facility cost drivers and techniques.

Injured worker engagement is critical to helping them return to functionality.


Mar
30

Benchmarks and outcomes

So what exactly are “benchmarks”?

Yesterday we dove into outcomes vs process metrics, and why focusing on process measures (e.g. call abandonment rate, three-point contact timeliness, savings below fee schedule) instead of outcomes can result in the classic…

Benchmarks are standards by which outcomes can be measured or judged. Outcomes drive process improvements, financial results, and most importantly, healthy, fully functional patients.

In work comp, you’ll most often see vendors or payers comparing their results to ACOEM and/or ODG...while that can be somewhat useful, it’s important to recognize several issues/potential limitations…

(beware of comparison’s to the vendors’ clients…while that can be helpful and illustrative, it’s usually a very small sample set, and begs the question – “just how good are the vendor’s overall results?)

  • median values are typically used…but they reflect average, run-of-the-mill performance, which is NOT the standard we should be aiming for.
  • data comes from a limited number of payers and other sources and may not reflect your injured worker population’s demographics, locations, injury types and other factors
  • case-mix adjustment tools can be very helpful – IF the tools are:
    • used with robust data sets that reflect your patient population,
    • specific to the time frames you are evaluating,
    • relevant to payer type, and
    • straightforward, with limitations explicitly acknowledged and explained.

This can get pretty complicated, as in migraine-inducing complicated. Don’t obsess…and unless you are a statistical whiz, Do NOT get caught up in the minutiae, it is up to the vendor to help you understand, not to baffle you with BS.

(very helpful to have a statistically literate person on your team to clarify, help explain, and when necessary call BS…there’s a LOT of it out there)

Rather, challenge the vendor to explain in layperson’s terms specifically and in detail why and how these benchmarks are relevant to your population, their limitations and strengths, and where you fall on the spectrum from worst to best. Also, get written documentation of their analyses and the methodology you can share internally and with your customers as necessary.

Vendors who cite benchmarks must be able to explain all of this...just don’t expect them to do this the first time around, as it is likely they’ve never been challenged.

What does this mean for you?

Know your outcomes.