Sep
1

Good news Friday – and implications for workers’ comp

Inflation. Employment. Manufacturing jobs. Wages.

All are in waaaaay better shape than they were a couple years ago.

What’s downright weird is how gloomy many are…in the face of pretty good news on many fronts. So let’s start the weekend off with what’s REALLY going on…

Inflation dropped to 3% – a third of what it was in June of 2022…when it was 9% –  “we’ve made a lot of progress [reducing inflation] without much pain. And I think that’s what’s critical so far.” says Stephen Juneau, an economist at Bank of America Merrill Lynch.

Employment  – there are one and a half jobs open for each unemployed worker which a) means there is NO recession and b) employers are in better shape than they were 18 months ago when there were more than 2 jobs per unemployed worker.

US manufacturing is roaring back...construction of new factories is at an all-time high and companies are adding over 400,000 new manufacturing jobs this year.

Wages are also going up – adjusted for inflation annual median household income was up over $3,000 over the last three years.

What does this mean for you?

Things are going pretty darn well.

As for the implications for work comp…this from a post in August.

Hundreds of billions of dollars is flowing into infrastructure, investment that has already created ninety thousand jobs in:

  • construction,
  • transportation improvements,
  • highway, bridge and road maintenance and replacement, and
  • heavy industry.

And many more jobs are on the way. (check out where this is happening here).

These are very well-paid, high-frequency and high-severity jobs.

This means premiums will increase as will claims and claims costs. And this will continue for years.


Aug
30

Medicare drug price negotiations – implications abound!

Medicare will negotiate drug prices, Big pharma’s really upset…AARP is really happy…what’s the REAL story?

Briefly…One of the key parts of the Inflation Reduction Act authorized Medicare to negotiate drug prices for 10 medications. Those 10 meds have been identified, and the howls of protest from big pharma are deafeningbut our profits!!!!!

chart credit arsTechnica

(Pharma is the most profitable sector in the economy with a gross profit margin double that of non-pharma companies)

Implications

for taxpayers, Congressional Budget Office (CBO) reports taxpayers will save $160 billion by reducing how much Medicare pays for drugs

for millions of Medicare recipients, drug prices and out of pocket expenses for those 10 drugs will drop by thousands of dollars…seniors currently pay up to $6,497 in out-of-pocket costs per year for these meds.

(due to the Inflation Reduction Act, starting in 2025 Medicare beneficiaries’ annual out of pocket drug costs will be capped at $2000)

for payers, the picture is pretty very complicated...netting it out, “these steps would lead to a higher MFP [maximum fair price] and less or no impact on the drug’s…commercial net prices [after rebates]…” [emphasis added]

lest you feel sorry for big pharma, you should know that the ten medications are “older drugs and drugs that have really been blockbusters in the Medicare program. So the companies that have made these products have really reaped handsome profits from those drugs for many years, before they’re even eligible for negotiation.” cite

oh, and about Pharma’s complaint that this will hamper innovation, experts disagree…overall changes to Medicare’s Part D drug program “will probably have a positive impact on drug innovation, especially in areas that address the unmet health needs of high-cost Medicare beneficiaries”


Aug
28

Fentanyl, immigration, and home health care

Illegal immigrants are NOT smuggling in fentanyl across the Southern border.

Americans are.

Yet half Americans  – and 6 out of ten Republicans – think it’s those damn immigrants.

I’ve been yelling about opioids of all types for almost two decades…and avoiding it for the last year or so because I’m burnt out on the topic. Yet here it is again, with demagoguing politicians and “news” outlets using the fentanyl crisis to scare the crap out of people by blaming brown folks for a crisis entirely of our own making.

News flash – WE Americans are consuming fentanyl…if we weren’t, there would be no crisis, no awful death toll, no broken families and destroyed communities.

And we Americans are the ones importing fentanyl.

From a Former Border Patrol sector chief:

Virtually none is smuggled by migrants themselves, says Victor Manjarrez, Jr., a former Border Patrol sector chief who’s now a professor at the University of Texas at El Paso.

“The probability that they’re going to carry some kind of illicit narcotic is probably close to zero,” Manjarrez said. “The vast majority of that fentanyl is going through a port of entry.” [emphasis added]

This is clearly a fact-free campaign to demonize immigrants, to scare us into voting for politicians that talk about building walls and banning immigration.

What does this have to do with healthcare?

I’m sooooo glad you asked.

As a nation – and individuals – we are getting older fast. Older = more need for healthcare = need for more healthcare workers.

Where are those workers going to come from? Are your kids signing up to be home health aides? Your neighbors’ kids?

Doubtful.

There is a crisis  – but is sure as hell isn’t immigrants bringing in fentanyl.

No, the crisis is in healthcare staffing, so blocking immigration is worsening the crisis.

By far the most projected job openings is in direct healthcare workers in the decade ending in 2026 – 2 1/2 years from now – we’ll need 1.4 million direct health care workers – plus over 400,000 nurses.

States most affected by the healthcare worker crisis include Texas, Florida, Nebraska, Alabama, Wyoming and Maine.

Where are those workers going to come from – especially home health care workers? Today, almost four out of ten home heath aides are immigrants; that HAS to increase if we are going to have enough workers to care for us and our parents and grandparents.

Meanwhile Canada is attracting immigrants by giving health care workers a path to citizenship.

What does this mean for you?

If you want to change your own bed pan, vote to block immigration. 

PS…I dumped Twitter and moved to threads – follow me there at joe_paduda


Aug
18

Long COVID is real, “social inflation” is not.

Didn’t post this week…was in Chicago for the annual father-son trip to watch the Sox play the Cubs…very fun time!

While I was relaxing in the stands, shockingly the world continued turning…

WCRI’s report on long COVID’s impact on work comp was release, examining claims with an average of 18 months post-infection…my takeaways  include:

  • one out of 19 COVID claims developed long COVID
  • medical costs average less than $30k
  • temporary disability benefits run a bit above 20 weeks
  • Long COVID’s impact on workers’ comp is pretty minimal

Risk and Insurance weighed in on “social inflation”, a not-well-defined term insurance folks use to characterize their not-very-well-founded belief that society is driving up casualty claim costs.  VERY briefly, insurance execs complain that high jury awards to claimants are driving up insurance costs…however there’s precious little real research supporting that view. 

This from Ken Klein’s presentation to NAIC in 2022…

What does this mean for you?

Stop catastrophizing until you can prove something exists.

Start catastrophizing when the data is convincing. 


Aug
14

1 +1 = 3

Two mostly-ignored things will have way more impact on workers’ comp than any other ten factors.

And as usual, workers’ comp is out to lunch.

Let’s quickly review the work comp industry’s failure to understand reality.  When COVID hit, the workers’ comp industry’s caterwauling and catastrophizing hit epic levels… mostly driven by

That led to far too much angst and far too little reality-based planning by the workers’ comp industry.

Fast forward to today, where the opposite is happening.

The industry is blithely ignoring the impact;

  • heat will have on claims, loss ratios, combined ratios, and claim duration, and
  • infrastructure investment will have on premiums and claims.

Heat

The massive and seemingly endless heatwave in multiple states is affecting restaurant workers, agricultural workers, folks in logistics and manufacturing.

Sure there’s heat exhaustion and heat stroke and heat prostration (which costs about $38k per claim…)

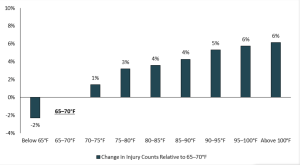
But that’s the (forgive the analogy) tip of the iceberg…Excessive heat also creates more injuries of all types…injuries to cherry harvesters in Washington State increase 1.5% for every 1 degree C above 25 C (77 degrees F) – mostly from falling off ladders.

Oh, and California data shows: compared to days with temps in the 60s,

      • on days when the temperature was between 85 – 90 degrees Fahrenheit…the overall risk of ALL types of workplace injuries was 5 to 7 percent higher.
      • when temps topped 100 degrees, the overall risk of injuries was 10 to 15 percent greater.

This means more claims in an industry that is generally unprepared to “manage” heat-related claims.

Jobs

Hundreds of billions of dollars is flowing into infrastructure, investment that has already created ninety thousand jobs in:

  • construction,
  • transportation improvements,
  • highway, bridge and road maintenance and replacement, and
  • heavy industry.

And many more jobs are on the way. (check out where this is happening here).

These are very well-paid, high-frequency and high-severity jobs.

This means premiums will increase as will claims and claims costs. And this will continue for years.

What this means for you.

At risk of belaboring the obvious, a more dangerous environment for many more workers  in already high-risk jobs. 

Heat + Jobs = more premium dollars, higher costs for self-insureds, more claims, and higher severity claims.


Aug
10

We are all Hawaiians

The disaster in Maui is one of the most awful things I’ve ever seen. An entire town of 12,000 is gone, burned to the ground by a horrific firestorm.

At last 36 are dead, while countless others survived only because they jumped into the ocean to avoid being burned to death.

Here’s how we should think about this.

Of all the places in the US, no one ever thought Maui, a tourist paradise, would ever be in the news for a devastating wildfire. If it can happen in Maui, it can happen in Ohio, or New Jersey, or your home town.

Think it can’t?

So did residents of Lahaina.

What does this mean for you?

Prepare. Now. Not tomorrow, not next week, not as a 2024 goal.  Now.

Here’s a detailed discussion along with a list of what to do.

note – I am on Threads – joe_paduda


Aug
7

Physician dispensing in work comp is roaring back

mostly because insurers and employers have a been asleep at the switch.

Republishing a post with minor edits from two years ago…LOTS more on the sleazy business of physician dispensing here

WCRI’s latest report finds:

  • Physician-dispensed drugs (PDDs) accounted for more than half of drug costs per claim in Q1 2020 in four states – Florida, Georgia, Illinois, and Maryland.
  • In 12 states, doc-dispensed dermatological agents accounted for most payments for this drug class.
  • Louisiana is worst-off, with employers paying $190 per claim for dermo drugs in the 1st quarter of 2020…Illinois is right behind at $181.
  • Kansas and Connecticut saw payments for those dermo drugs triple from Q1 2017 to Q1 2020.

That profit-sucking prescribing by docs in Connecticut is why total drug spend increased 30% in the Nutmeg State – making it one of two states that had drug spend increases. Florida – the home state of PDD – was the other. (Across all subject states, drug costs dropped 41%.)

Having lived in CT for over 20 years, I’m really stumped by the precipitous increase in skin care drugs.

What could POSSIBLY be driving this massive need for occupationally-driven skin care/topicals?

  • Did sun spots create a pandemic of skin cancer but somehow only affect the second-smallest state?
  • Did a massive refinery accident expose tens of thousands of workers to burns or skin infections?
  • Did a hyper-virulent new breed of poison ivy run rampant, affecting thousands of landscaping and municipal workers?
  • Did the emerging cannabis industry fail to protect its workers from fertilizer burns, exposing thousands of workers to painful blisters?
  • Did everyone in Connecticut suddenly become unable to swallow a pill?

Of course not.

The real question is this:

why haven’t insurers, TPAs, and self-insured employers used CT’s Medical Care Plan to ban physician dispensing? Payers including the Workers’ Comp Trust of CT have pretty much eliminated physician dispensing.

It’s not just Connecticut.  PDD costs are outrageous, and all credible research indicates PDD is totally unnecessary, increases medical costs, and prolongs disability.

WCRI’s research should be a call to action.  Legislators, regulators, and payers are doing their policyholders and clients a disservice by failing to aggressively attack physician dispensing.

And those clients and policyholders are equally at fault – it is up to you to work with your PBM and payer to stop this rampant profiteering. 

What does this mean for you?

Yeah, I know it’s hard.

Stop whining and get serious.


Aug
3

Survey of workers’ comp bill review – Fourth edition

Our fourth (!!) Survey of Workers’ Comp Bill Review is nearing completion…one of the good things about doing this every few  years is we can identify trends and the industry’s evolution.

This year we surveyed both executives and front-line staff. Shockingly, they didn’t always agree…

a few initial takeaways…(ratings are 1 – 5, with 5 being the best)

  • The Bill Review industry generally held its level of support from 2018. Overall average (all vendors grades from all respondents) was 3.2, just above, equal to 2018.
  • Despite respondents’ overall view not changing, there’s less differentiation among the major players; scores have compressed.
  • New entrants are making inroads
  • Customer service remains absolutely critical to a successful bill review relationship: considered the top reason a company would change bill review vendors and consistently ranked near the top for “most important bill review attribute”.
    • this is consistent across the dozens of surveys of all types HSA has done over the last 2+ decades…
  • There is a noticeable difference between executives and front line employees when evaluating customer service – front line average score 3.6 vs. 4.2 for executives.
  • Front line employees have different criteria for quality customer service than executives’…: front liners do not seem to care much about soft skill aspects of customer service but rather customization and timely updates while executives have a more traditional sense of customer service.
  • Automation is on most people’s minds – but it isn’t all positive. While nearly all talking about it want more automation (for TAT/auto-adjudication/quality reasons) some still need it to handle the basics better than it currently does.
  • E-billing, for largely the same reasons as automation, is getting more popular – especially among larger respondents and internally run bill review respondents.
  • Bill review vendors are seen as quite transparent – especially compared to 2018. 90% of respondents believed their bill review vendor to be transparent vs. just 52% in 2018. This is despite several complaints about how convoluted % of savings can be.
  • Flat rate pricing is rising in popularity while % of savings is not viewed favorably in most cases.

Cautionary note – these highlights are just that – highlights – and there’s often a lot of nuance underlying respondents’ views and perspectives. That will be described in the final report …a public version of the report will be available in a few weeks. (Respondents get a much more detailed version).

What does this mean for you?

Customer service.


Aug
1

RAND’s report on Alternative payment models in work comp…oh my…

RAND’s long-awaited research paper on Alternative Payment Models for California Workers’ Comp is out.

It is…underwhelming, incomplete, doesn’t focus on key metrics, did not include actual examples of APMs in WC (of which there are many), makes inappropriate comparisons, and…I could go on.

Yeah, I know it’s an initial study, but C’mon…

First, a couple intro notes…

    • in laypersons’ terms, Alternative Payment Models (APMs) are different payment schemes/methodologies used in an attempt to improve care/patient experience/save money.
    • APMs include pay for performance, bundled payments (e.g. flat fee for a surgical episode), per member per month flat fees, global payments and other models.
    • APMs are quite commonplace in Medicare/Medicaid, group health, and exchange healthplans and have been for years.
    • Broadly speaking, despite LOTS of different approaches, studies, methods and work, to date APMs’ impact on those metrics has been marginal.

OK…initial takes on RAND’s report. (note I haven’t thoroughly reviewed and analyzed all 95 pages, but wanted to get this out ASAP)

APM in WC

Most importantly, there have been numerous experiments AND long-standing programs with “alternative payment models” in California and other states…somehow RAND missed these. Yes RAND noted Ohio and Washington have done work on APMs, but RAND missed:

  • Carisk’s Pathways2Recovery Program (Carisk is an HSA client)
  • Paradigm’s HERO programs. – models include full risk transfer and episode of care payment for shoulder, back, knee and other diagnoses.
  • Medrisk has had an episode-based managed physical medicine reimbursement model in place for decades. (Medrisk is an HSA client)
    • other specialty network/service companies have had similar programs
  • and others I don’t have time to get into.

I note that these are very patient- and condition-specific and narrowly focused – similar to many group health/Medicare/Medicaid APMs…yet should have been included.

Inpatient vs outpatient

Across all payer types, care has been shifting from inpatient to outpatient settings. Unfortunately RAND spends a lot of time on inpatient APMs and nowhere near enough on the outpatient side. 

Outcomes

What is critically important in workers’ comp (and I argue SHOULD be across all payer types) is sustained and rapid return to functionality. There is precious little discussion of the central importance of this primary goal – and how it might/might not be affected by myriad different APM models/studies discussed in RAND’s report.

Comparisons

RAND relies extensively on comparing hospitals in the Hospital Value-Based Purchasing Program (HVBP) to critical access hospitals that are not in that program…without much discussion of the key differences between these facilities, differences that – I would argue – make comparisons sketchy at best.

One issue – poorer patients are more likely to get care at and represent larger percentage of the patient population at critical access facilities…that demographic also consistently rates patient experience lower than wealthier patients. Thus, comparing HVBP program patient experience data to critical access hospital data is difficult – at best.

Access to care

RAND makes a major point about “stakeholders” concerns about access to care. Actual real scientific research paints a different picture.

Let’s get real.

There’s a whole shipload of factors that RAND mentions (very briefly) that deserve a LOT more discussion.

One example – less than a penny of the US healthcare dollar is spent on workers comp medical. That, dear reader, makes it really hard to get the vast majority of health care providers to do ANYTHING.

What does this mean for you?

There are APM in WC…and a lot of history and knowledge and research and expertise around them. Much could have been learned if they were fully considered. 

For a lot less money.


Jul
31

Just the facts, ma’am…

Another day, another record-breaking heat wave. And this one is really really bad.

Amazon workers are going on strike…construction crews on the Canadian border are knocking off early to avoid heat…Florida utility workers are postponing checks for gas leaks due to excessive heat risks

Yet some folks still don’t think we humans are the problem…they call up all kinds of specious arguments supported by “I read an article…” “They said…” “This one scientist”

I’ve put together a handy point:counterpoint addressing deniers’ arguments…feel free to plagiarize!

About global warming!

Denier: Scientists don’t agree that humans are driving global warming or, another equally wrong argument that “non-human events” (volcanoes??) are the driver.

Well…Net is even four years ago, almost every climate scientist agreed global warming is caused by humans.

Every credible scientific organization agrees.

More than 400 billion metric tons of carbon have been released into the atmosphere from the consumption of fossil fuels and cement production since 1751- half of which was emitted since the 1980s. 

There are no credible sources asserting non-human greenhouse gas production is a significant contributor to the 45% increase in carbon over the last 150 years. (If you have any, please post in comments below)

Denier: The climate changes all the time…those scientists don’t know why.
Well…research shows climate changes NOT associated with greenhouse gases were most likely generated by earth’s wobbling on its axis – and the sun was cooler long ago.
Denier: You can’t prove human-generated greenhouse gas increases are causing these big weather events.
Well…yes we can.  Attribution science is becoming ever better at predicting future events based on human-caused global warming’s effects.
Denier: Weather was worse (pick a time) and here’s a chart/graph/meme that proves it.
These are misleading misuses of data from credible sources...one fave is this – which is actually from the EPA…which deniers use to say “see…it was worse back in the thirties!!”
A graph showing the temperature of the year Description automatically generated
Well…a “heat wave index” is really misleading as it refers to a specific event – a “heat wave” and doesn’t address global warming.  Fortunately, the EPA has this. As you can see, things varied in the past – up until about 1980…then, the trend is only up.