Mar
1

WCRI’s John Ruser on today, tomorrow, and next year

Late last week I sat down with WCRI President/CEO John Ruser to get his views on his first few months at the helm, find out what’s on the agenda at the WCRI conference next week (if you haven’t registered, get your fingers over here), and learn about future areas of focus.

MCM – What has been the most eye-opening for you as you’ve moved from the Bureau of Labor Statistics to WCRI?

Ruser – First off, it is an honor to take the helm of such a well-regarded organization with such a diverse membership and to be working with such an intelligent and talented group of colleagues who are committed to publishing high-quality, credible and independent research. Along those lines, what has been most eye-opening has been the tremendous support for the research from all stakeholders in the workers’ compensation community. I’ve always knew WCRI was well-regarded, but when you are in the position I am in and interacting with people all across the country, you really understand how truly special WCRI is and how important the mission is to provide policymakers and other stakeholders with the data they need to make more informed decisions.

MCM – What has been the most fun?

Ruser – Working for BLS, you put out data and that is it. However, WCRI has so much interaction with the workers’ compensation community through their rigorous quality assurance process (i.e., reviewers, state advisory committees, etc.). The other thing that makes WCRI different is our mission, which is to be a catalyst for significant improvements in workers’ compensation systems. So that is what is fun, to see the research being used by the community it is seeking to help.

MCM – What will attendees learn at WCRI’s conference next week?

Ruser – A big area of interest this year is opt-out. We have two sessions on opt-out that will provide a deep dive from multiple viewpoints. In addition, researchers from the Dartmouth Atlas project and NCCI will join our staff to discuss interstate variation in medical treatments. The conference will also include the latest research on prescribing of opioids across the country, which is an issue that garners great attention in and outside the workers’ compensation community. We are hopeful that presentations on the issue lead to changes.

MCM – Do you see changes in the research focus of WCRI going forward?

Ruser – Over the next two years, I expect we will be doing a lot of work on treatment guidelines; their impact on outcomes, procedures, costs, and injured worker outcomes. We are also working on an update on injured worker outcomes with surveys of injured workers. Areas covered by the surveys include access to and satisfaction with medical care, return to work timing, and earnings loss. There has also been a lot of interest in our work on case-shifting, so we will be doing a study to see if there is evidence of case shifting due to high deductible health plans.

MCM – Can you give a bit more detail on treatment guidelines? What’s driving that focus?

Ruser – In discussions with our members and other stakeholders, treatment guidelines have risen to the top of the priority list. There is interest in learning what leads providers to use treatment guidelines and to what extent treatment guidelines affect outcomes. Utilization review (UR) and compliance issues affect the former. We want to better understand what kind of programs are out there and how are they being used, do treating physicians comply with guidelines?, are denied services paid?, what are providers’ views of these programs.

We have begun semi-structured interviews with physicians in Louisiana re guidelines, and have seen a wide range of responses. We are learning a lot about providers’ views and, at the same time, gaining experience and expertise in collecting, analyzing, and using information from free-form surveys.

I expect we will use what we’re learning about text mining in another area – triggers of claimant attorney involvement. This gives us an opportunity to explore using broad questions to collect unstructured data, and then code that data to provide information. There is tremendous opportunity to use less-structured information in our research.

Jan
18

How to reduce medical costs the easy way

Here’s one very effective way to reduce medical spend.

  1. Identify low-cost providers.
  2. Send your patients to them.

Do NOT send your patients to providers because they give a discount.

Do NOT send patients to providers because those providers are “in network.”

Fact is, there is wide variation between and among providers in the same geographic area – for the same procedure.

Another fact is, there’s no correlation between cost and “quality”.

There you have it.


Dec
17

ACA, work comp, and case shifting – the details

Last week’s webinar on ACA and the possibility of case-shifting due to capitation was quite well attended – those who could not make it can take a listen by signing up here (there’s a fee for members and non-members of WCRI).

I was honored to be asked to participate, asked to present a different perspective (namely, it’s very hard to attribute case-shifting to ACA) based on what I see as a very complex and diverse health care world.

Here are a few reasons for my skepticism.

The argument for case shifting requires several assumptions:

  • HMOs are capitated
  • there are financial incentives e.g. capitation at the primary care level
  • primary care providers are aware of the financial implications of case assignment
  • PCPs purposely assign cases to work comp based on those financials
  • the ACA will lead to more Accountable Care Organizations that will use capitation more

A couple observations.

  1. About 2/3 of HMOs use capitation to reimburse provider groups.
  2. About 60% use some form of fee for service, so many HMOs use BOTH capitation AND FFS.
  3. Almost all PCPs are NOT paid by capitation.  In fact, PCPs are most often paid by FFS.
  4. Some – but by no means all – ACOs contract with employers.  Capitated reimbursement is almost unheard of in these arrangements.
  5. The interaction of reimbursement and physician behavior is complex and by no means straight forward.

So, while the provider group is frequently capitated, the providers within that group are not.

There’s also no indication that capitation at the group level is becoming more popular under ACA.

Finally, I’d suggest that folks really interested in this take the time to dig deep into provider reimbursement under ACOs and ACA and HMOs.  It’s very complex, far from simple, and, as Jaan Sidorov illustrates so eloquently when describing a research study intended to promote standards of care:

This study should give pause to anyone who thinks that physicians can be manipulated with more money.  They live by more than bread alone.

What does this mean for you?

When you think you are starting to figure things out, it’s probably because you just haven’t looked deeply enough.


Dec
8

Does the ACA cause providers to shift cases to work comp?

The ACA is in place and causing massive changes to the provider and payer landscape. One question broached by WCRi in recently-published research deals with the possibility of “case shifting” from group health to work comp.

That is, do primary care providers selectively “allocate” cases to work comp based on reimbursement motivations?

If yes, there are obvious and significant ramifications for all of us, many of which will have negative consequences for employers and insurers.

But, in my view, the picture is anything but clear – on many levels.

WCRI’s hosting a webinar this Thursday at 2 pm EST on the topic.  They have been kind enough to invite me to present a contrasting perspective.  There are already over 100 registrants, so the good folk from WCRi have opened up registration to accommodate the demand.

Sign up here.

Webinars are $39 for WCRI members; $79 for non-members; and no charge for members of the press, legislators as well as their staff, and state public officials who make policy decisions impacting their state’s workers’ compensation system.

See you there.


Dec
3

Health care spending up 5.3% in 2014

Health care costs accounted for 17.5% of GDP last year after a 5.3% increase in spending. 

The overall spending increase, which followed 5 years of relatively low inflation, was attributed primarily to the addition of 8.7 million people to the rolls of the insured in 2014.

Health Affairs reported the biggest jump was in pharmacy costs which increased 12.2%, driven in part by Hepatitis C drugs including Sovaldi and Harvoni, both manufactured by Gilead. The big increase came despite a rise in the generic dispensing rate to 81.7 percent, up from 80.1 percent in 2013 and 77.3 percent the year before.

Total pharmacy costs were just under $300 billion with Hepatitis C drugs accounting for $11.3 billion in total spend.

Other goods and services also saw increases:

  • Hospital costs accounted for $972 billion, an increase of 4.1 percent. This was little changed from 2013’s 3.5% trend.
  • Physician and clinical services rose 4.6 percent to just over $600 billion.  The increase was due to a major jump in Medicaid expenditures.

Looking a bit deeper, Health Affairs broke down the cost increase to separate out the effects of price, demographic, and utilization:

Of the 4.5 percent increase in per capita health spending in 2014, changes in the age and sex mix of the population accounted for 0.6 percentage point, medical price inflation accounted for 1.8 percentage points, and the change in residual use and intensity accounted for the remaining 2.1 percentage points.

Interestingly, private households didn’t see much of an increase in costs; the report indicated a rise of less than 1.5%.


Nov
2

The IMR debate is focusing on the wrong metric

Now that California’s courts have ruled the IMR process is Constitutional, we can hope things will settle down, docs will start learning what is acceptable and what isn’t, and needless friction will decrease.

Unfortunately that isn’t likely.  If history is any indicator, a very few docs will continue to flood the system with thousands of requests for IMR, most of them for drugs and procedures that fall far outside the state’s evidence-based clinical guidelines.

Let’s acknowledge that the system – like any – isn’t perfect.  Let’s also acknowledge that all the data, research, and credible study to date indicates it works quite well.  What’s lost in the data-driven debate is the real problem – we aren’t looking at the right metric.

As CWCI has documented, well over 90% of all work comp medical procedures, tests, drugs, and treatment are approved.  And, when appeals do get to the last stage; the Independent Medical Review:

Data on the IMR outcomes show that 91 percent of all IMR decisions upheld or agreed with the physician-level utilization review opinion, while conversely, 9 percent of medical service requests submitted for IMR after being modified or denied by a UR physician were approved by the independent medical reviewer.

I’d suggest the CA UR and IMR process is approving TOO MUCH care.

Does anyone think that 94%+ of all medical procedures requested or delivered to California’s work comp patients are medically necessary, appropriate, and the best possible care?

Didn’t think so.

There’s no question too much care can be quite harmful.  The rampant overuse of opioids in workers’ comp is but one example of far too much care causing grievous harm.  Add in far too many spinal surgeries with lots of implants, and one can see that these “approved” services are far from optimal care.

What does this mean for you?

Why aren’t we focused on making the UR process tighter with more stringent controls and requirements before potentially dangerous and debilitating treatment is authorized?


Oct
30

Friday catch up

Heading home from California, where I had the honor of spending most of a day with the good folks at the California Workers’ Compensation Institute.  Really fun (yes, fun!) to discuss research topics, methodologies, limitations, and uses with the real experts. CWCI has a robust research agenda heading into the winter, and we’ll see much of it published before their annual meeting.

Which is a “don’t miss”.

If you haven’t seen their latest work on drug testing in work comp, it is well worth a read.  This is one of those complicated topics where a brief scan of the report isn’t enough to do it justice.

There’s been a lot of great research from NCCI and WCRI published recently as well.  I’ll be able to work thru the backlog while enjoying a cross-country flight, and will report back on Monday.

In the interim, there’s been a bit of buzz about a big acquisition of late.  I’d suggest that folks take a deep breath and relax.  These things take a lot of time, there are lots of regulatory hurdles to navigate, and things are especially sensitive when a publicly-traded company is involved.  If you are thinking something will happen before NWCDC in Vegas, you should re-think.

Finally, the just-announced Stevens decision affirmed the Constitutionality of California’s IMR process.  This is BIG NEWS, as it removes a lot of uncertainty about utilization review and related matters. Read Stephanie Goldberg’s piece for the details.


Oct
7

Workers’ comp pharmacy costs – Survey says…

CompPharma, a consortium of workers’ comp pharmacy benefit managers, released the 12th Annual Survey of Prescription Drug Management in Workers’ Comp yesterday.  The Survey is an in-depth look at the issue based on telephonic interviews with 21 TPAs, insurers, state funds, and self-insured employers.

This year, we (I’m the author of the study) found that drug costs increased across all respondents.  Comparing total 2013 and 2014 drug spend across all respondents, costs climbed 6.4%.

However, that increase was driven by a minority of respondents as only 7 of the 21 saw costs go up.

Looking at inflation another way, we also calculated the average increase for each respondent; trend was essentially flat.

We offer these different metrics to provide readers with as much data as possible so they can draw their own conclusions.  One could argue that you have to look at cost changes across an entire industry to really understand what’s happening.  Another perspective focuses on individual payers. As the payer’s policyholder base doesn’t change that much from year to year, a payer-specific view is more accurate.

The big question is what is driving drug spend increases.  In that, respondents’ views were pretty consistent – physician dispensing, opioids, and compounds.  I’d note that the industry has had some pretty good success addressing opioids; PBMs that report on this have all been able to decrease opioid spend over the past couple of years.

Another cost driver, mentioned by a couple respondents, was likely a major contributor: price inflation for generic medications.  Fortunately, that has leveled off somewhat of late, although entrepreneurs will continue to look for opportunities to make their fortunes by buying up manufacturers (of little-used drugs) and dramatically increasing prices.

A couple points that bear making.

First, work comp pharmacy is about as different from group health/medicaid/medicare as chalk and cheese.  There are:

  • no deductibles, copays, coinsurance, or other cost sharing for patients
  • wide-open choice of drugs except in TX OH WA and OK
  • most spend is for pain; 24% of dollars go for opioids while about 84% of spend is for pain

Second, the PBM industry has done a remarkable job of bringing down the rate of inflation over the last dozen years.  Yes, there have been a couple spikes over that time, but ten out of twelve years we have seen a ‘decrease in the rate of increase.”


Sep
29

Causation and Correlation and the fallacy thereof

There’s a big difference between “causation” and “correlation”.  Just because A is around when B happens does not mean A causes B.  It could be that A’s friend C is actually the instigator, and A and C happen to hang out together a lot.  Or let’s say B is graffiti at the subway. A can only get out of school on Saturdays which is the only day B occurs because that’s when the graffiti school has their practical exercises.

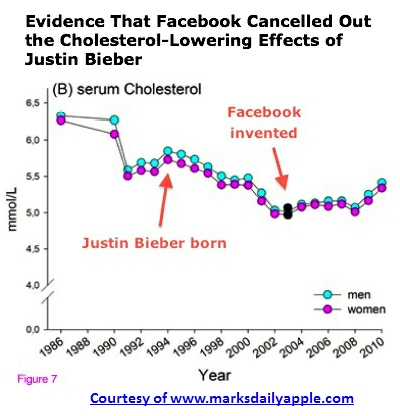
Or, to be a bit more complex, when Justin Bieber was born, cholesterol scores began to decrease.  Until, that is, Facebook was invented, which reversed the decrease, thereby proving the Beebs is not as powerful as Facebook!

justinbeiber

Did you know that the more mozzarella consumed in the US, the more civil engineering degrees that are awarded?

Did you know that the age of Miss America strongly correlates with the number of murders by steam, hot objects, or hot vapours?

And the more the US spends on science research, the higher the number of suicides by suffocation strangulation, or hanging… (damn science!)

For those consumed by marriage in Kentucky, know that the marriage rate is closely tied to the frequency of death by falling out of a fishing boat.  Perhaps a fishing honeymoon involving moonshine is a time-honored tradition in Kentucky…

Now you know…

But seriously folks, even esteemed medical journals sometimes screw this up – HealthNewsReview highlighted one such faux pas last week in the British Medical Journal of all places.

According to HNR, a BMJ piece about SSRIs and crime stated:

‘Use of selective serotonin reuptake inhibitors (SSRIs) increases the rate of violent crime among young adults.’

The piece SHOULD have said “there is a correlation between SSRIs and an increased risk of violent crime among young adults.”

See the difference?  A statistical correlation does not mean one causes the other. In fact, it could be that violent youths are more likely to be prescribed SSRIs, or the crimes studied were committed in an area where psychiatrists prescribe SSRIs a lot more often than in other areas, or any one of dozens of other reasons.

I bring this to your attention, dear reader, because there’s far too much sloppy reporting out there that confuses correlation with causation, often by folks that should know better.  

What does this mean for you?

Think critically.  Always.  


Sep
4

Work comp medical spend and other fun facts

In my ongoing effort to serve the public good, here are current facts and figures related to how many dollars are spent on medical care in worker’s comp. 

Total medical dollars

In 2013 workers comp medical spend totaled $31.5 billion.  Source – NASI’s Workers’ Compensation 2013 Report.  NASI is the definitive source for this data; their primary sources are NCCI for the 38 states where NCCI is the rating agency and state rating agencies/bureaus for the other 13.

Worker’s comp medical trend rate

NCCI’s Annual State of the Line presentation at the firm’s Annual Issues Symposium provides the earliest – and most complete – insight into medical inflation.  For 2014, initial indication was medical severity for lost time claims increased 4 percent.

A couple of caveats – this is for lost time claims only; while LT claims account for the vast majority of medical spend, medical only claims account for perhaps 15% of spend.  In addition, NCCI’s data does not include self-insureds; about a quarter of comp benefits are self-insured.

Pharmacy spend

Work comp pharmacy spend accounts for somewhere around $5.5 – $6 billion.

Sources

  • Internal HSA data from research projects (my consulting work)
  • NCCI – by their estimate drugs accounted for 18% of all medical expenses in 2011; note that this is based on total incurred cost, or for the layperson, their estimate of what the total including already-paid and future drug costs. Therefore this isn’t actual annual “spend”. And, the data comes from 2011 reports.  There’s a lot more to this, but suffice it to say the $ range above is solid.
  • note – some claimants are submitting their work comp scripts to their group health plans.  While this won’t affect “spend”, it does impact the addressable market.

There are a lot of other sub-categories out there – and just as much confusion about what services, codes, provider types, or locations of service belong in what buckets.

If you are attempting to categorize spend, make very sure you understand your sources’ definitions.  E.g., script count; how do you define a “script”?

  • Is it the prescriber’s prescription written out for a patient?  If so, understand that most “scripts” include 2+ drugs.
  • Is it each individual medication prescribed?  If so, understand that some “scripts” are for 3 days’ supply, others for 90.
  • Is it for a certain number of days’ supply?

Different stakeholders use different definitions – and not just for pharma.  How is “surgery” captured, and what is included?  CPT codes? Facility fees?  Associated office visits? Bills submitted by providers with a surgical specialty?

I could go on, but hopefully you get the (cloudy) picture by now.  If not, your bad.

What does this mean for you?

Work comp data is dirty, inconsistently categorized, and there are no single sources for all categories/spend types.

If you want to really understand the space, get granular, precisely understand definitions, and do NOT make any assumptions that other non-primary sources have got it right.