Jan
4

Stuff you may have missed…

Spinal cord stimulators...Don’t work.

More specifically, multiple high-quality studies found little evidence of pain reduction, no impact on disability, no impact on opioid use, and a relatively high risk of complications (about one in five patients required device revision or removal)

Just as bad, the SCS industry fought back with highly questionable tactics: this from JAMA reported in MedPageToday:

 “Industry-funded critics of independent studies often do not follow the usual route of scientific discourse…

Rather than respond to the journal where the original study was published, critics frequently publish in journals where they are the editors and can control the discourse (15 of 18 letters criticizing the independent studies cited in this article appeared in journals with industry-affiliated editors)…

The journal can then choose to paywall the subsequent response from the independent authors, giving critics the last word.”

and criticisms are typically narrow (but they didn’t look into the benefits for left handed red heads who speak Swahili!) and/or specious.

The net – science indicates the risks of SCS are high indeed, while the benefits of SCS are sketchy at best.

FDA approves test to assess opioid addiction risk

From the FDA

“The AvertD test is intended to be used before patients who are being considered for a 4- to 30-day prescription for acute pain (e.g., for a planned surgical procedure) are first exposed to oral opioids. It is not intended for patients being treated for chronic pain.”

Excellent news indeed!

The test is NOT yet available…check here for more info.

Net – get your Medical Director(s) on this post haste to determine coverage policies and reimbursement.

Opioid settlement dollars

are in high demand, with a bunch of companies coming up with very creative ways to stick their heads in the trough. Spiderman-type cord wraps for police, locking pill bottles, safe disposal envelopes are among the pitches governmental entities are getting for their opioid settlement dollars.

Two points – 

  1. addiction counseling, behavioral health, and other patient care is what is needed – and where dollars should go.
  2. illicit fentanyl is the big problem now – expensive locking pill bottles and disposal envelopes are marginally useful.

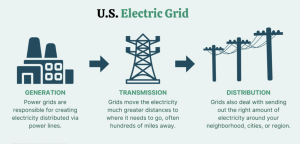
Texans may see rolling blackouts this winter, with implications for businesses, public safety employees, utility workers and essential workers.

In October ERCOT – the state’s power regulator, “… issued a request to increase [electricity producers] power capacity ahead of winter’s peak load season in Texas but canceled the request after it only found an additional 11 megawatts out of the 3,000 it was looking for.”

Power producers pointed to ERCOT’s request as too little, too late; University of Houston Energy Fellow Ed Hirs: “Just simply throwing some money out and hoping that people could bring a coal-fired power plant back out to operational capability within a period of weeks was really, ridiculously, ambitious.”

It’s not just Texas…with changing winter weather patterns driven by climate change other states are also at risk of similar blackouts.


Dec
18

Provider consolidation = Higher workers’ comp costs, longer disability

Healthcare provider vertical integration increases work comp medical costs, increases disability duration, and does not deliver better outcomes.

And, provider consolidation continues to increase.

The lede is the one-line summary of WCRI’s latest – and quite useful – research.

Olesya Fomenko and Bogdan Savich collaborated on a very well done study of vertical integration of providers’ impact on work comp, and their research bodes ill indeed.

Summarizing the experts’ findings, vertically integrated providers had: 

Some detail…courtesy WCRI

And if you think that’s bad…here’s the impact on disability duration…

These conclusions generally align with what we’re seeing from other payer types…consolidation leads to higher prices and negative to neutral impact on outcomes.

That isn’t stopping consolidation  – far from it.

What does this mean for you?

Find out how consolidated provider markets are where your business is. And watch for more consolidation, as that will predict higher costs.


Dec
15

Well that was a GREAT Thursday.

The FED announced that not only is it not raising rates, it plans on cutting interest rates next year. While that’s great news indeed, what drove the FED decision shows the economy is doing well – and will get better.

From Reuters quoting FED Chair Jerome Powell:

  • “We are seeing strong growth that … appears to be moderating.
  • We are seeing a labor market that is coming back into balance …
  • We’re seeing inflation making real progress,” [emphasis added]

In fact, personal consumption expenditures inflation is seen ending 2023 at 2.8% and falling further to 2.4% by the end of next year

And, betting markets predict the FED rate will drop 1.5 points – below 4% – over the next 12 months.

Stock markets boomed, with the DOW hitting an all-time high and the S&P close behind.

And home mortgage rates are back below 7%, and headed down from there.

What does this mean for you? 

  • Lower credit card interest rates so consumers will spend more,
  • cheaper mortgages will mean construction will increase,
  • which means more jobs.


Dec
14

Electric grids, infrastructure, jobs and payroll

In which we briefly discuss the power grid, jobs and what it means for you.

The good news is the Inflation Reduction Act (IRA) and bipartisan Infrastructure Investment and Jobs Act invest billions of dollars to upgrade the nation’s electrical grid.

courtesy Carbon Collective

(a connected grid enables operators to send power from places where there is plenty of electricity – say Arizona – to places where demand is super high – say Oklahoma during a deep freeze)

Dollars going to infrastructure are a major reason construction spending has jumped..it’s now more than a third higher than pre-COVID

Paralleling investment, construction employment has dramatically increased and is well above pre-pandemic rates..

source – FRED

What does this mean for you?

More investment = reliable infrastructure + more jobs = higher payrolls = higher premiums.

A very good explanation of the grid, transmission, and electricity production is here.


Dec
8

Facts for this weekend’s chats!

Whether you’re chatting around the grill, conversing at a swim meet or hockey game, or between quarters of a football game, here’s the real scoop on the economy, with immediate responses to show you’re the one with the real story.

hint…the “everything sucks” narrative is flat out wrong.

  1. No one wants to work these days! 

Surprise…

Net is the percentage of everyone 16 and older working today is within a half point of pre-COVID participation rates.

No, there is NOT some huge number of Gen Zs, millennials, or whatever that’s said “screw it, we’re outta here, and I’m gonna live with/off my parents forever!”


And…for the core group – folks 25-54 – labor force participation is near an all-time high at 83.5%!


2. Well…there just aren’t that many people working!

Hmmm…There are more people employed now than ever, and employment has been increasingly steadily for the last three years.

credit FRED.

3. Okayyyyy…but inflation’s higher than wages, so we’re falling behind!!

Well, no – since way back in March – 9 months ago – earnings are growing faster and more than inflation, so you can buy MORE with your weekly paycheck today than you could a few months ago.

source Statista

What does this mean for you?

You are gonna be soooo smart.


Nov
22

Getting smarter about PT.

Why do some patients need more PT than others?

Why does a therapist’s treatment duration vary for patients with the same diagnosis?

What conditions have the most impact on patient recovery?

Thanks to WCRI’s Vennela Thumula PharmD; Randall Lea MD; and Te-Chun Liu there are answers.

WCRI’s latest research based on FOTO data digs into just how big an impact mental and physical health co-morbidities – and other factors – have on improvements in functional status.

The methodology is robust indeed, the data solid as it gets, and the insights provided by the researchers quite valuable.

Using FOTO’s 100 point scale, their research indicates patients with both physical health and mental health comorbidities see about 20% less improvement in functional status than patients with no comorbidities.

courtesy WCRI

Co-morbidities – aka health conditions a patient has in addition to the one you’re focused on – may be physical – think obesity, hypertension, arthritis – or mental – depression, anxiety/panic attacks, sleep dysfunction.

Quick takeaways…

About two-thirds of patients have a physical or mental health comorbidity, and these comorbidities definitely affect the patient’s ability to recover.

The more comorbidities a patient has, the greater the impact on recovery.

More troubling still, the more likely these patient would have “very limited” function at the end of therapy.

The researchers also looked at the same metrics for non-work comp patients…and found comorbidities had similar if not more impact on recovery.

And…it isn’t just comorbidities.

Quicker access to PT had an even greater impact on recovery than physical or mental health complications. The details are on page 43 of the study. If you’re not a WCRI member, become one to get access to all their great work at no charge.

Non members will have to pony up a few bucks to learn more.

What does this mean for you?

Great research is really useful…use this to help injured workers get better faster. 


Nov
10

Good news Friday – unemployment and wages are up…inflation is DOWN!

Sometimes the experts get it wrong – really wrong.

Which can be very good news indeed.

Exhibit 1 – Surprising many economists, the “soft landing” – reducing inflation WITHOUT super high unemployment – is real.

A key indicator shows the inflation rate is now lower than it was 2 years ago.

Now…you will hear some caterwauling that this or that measure is wrong because it isn’t what people actually buy. Okay, let’s look at what people actually spend their money on – a metric called the “Harmonized Index of Consumer Prices” – it’s the green line in the graph below.

As of July 2023, that rate is a paltry 2.5% – right in line with the Fed’s desired inflation rate.

Make no mistake, engineering a soft landing defined as fixing inflation without high unemployment – is rare indeed…Those of us who remember the early eighties recall mortgage rates of 17%, unemployment in the high single digits, and a job market that was horrible/awful/lousy…(I graduated college in 1980…)

The other part of this is wages…which have gone up by about the same amount as inflation – except for nonsupervisory workers.

Those workers have seen “considerably” higher wage increases. The recent strike settlements will make those workers even happier…which will drive consumer spending…which drives the economy…which increases tax revenue…which lowers the deficit.

For some reason a lot of folks don’t believe things are going well…in fact, a recent poll “found that 51% wrongly believe that unemployment is nearing a 50-year high rather than those who believe it’s actually low (49%).” [emphasis added]

When you’re in a funk it can be tough to believe there’s good news…but things will get even better.

Over the next decade, the Inflation Reduction Act, CHIPS Act and other legislation will create another 1.5 million jobs – per year. Source is Moody’s Analytics)

What does this mean for you?

The economy is good – and getting better – and this is very good news indeed.


Nov
9

When you’ve seen one state…

The brainiacs at NCCI have a must-read post detailing physician services’ costs and utilization in most states.

Gotta say this is one of the most useful and insightful analyses I’ve seen from anyone. Kudos to NCCI.

Couple highlights…

  • VERY wide range of physician costs – on a service year basis, state costs range from $800 to almost 4 times that.
  •  Using NCCI’s utilization metric (units), utilization varied almost as much – from fewer than 1000 to more than 2500 units.
  • one of the most insightful learnings is about the factors contributing to variations in utilization…

  • “service intensity” is the most important driver of variation; NCCI’s definition is the “collection and type of physician services rendered on average for a claim given its diagnosis and whether there was a major surgery.”

What does this mean for you?

Your medical management strategy MUST be state-specific. 


Nov
7

CompScope is up…medical costs are not.

It’s that time of year…when the brilliant minds at WCRI release the latest CompScope report.

The top finding…is likely to surprise many…

Couple observations:

  • yes, this was during COVID….medical costs during COVID were LOWER, not higher than previous in previous years. Those who understand medical care delivery anticipated this, alas that is a very small group.
  • no, medical costs in comp are NOT increasing significantly. Haven’t been for years.
  • That’s because we’re still benefiting from the opioid hangover effect.

Warning – Medicaid disenrollment aka “screw the poor folks” will push facilities and healthcare systems in many states to look for revenue replacements.

And, because work comp is pathetically awful at controlling facility costs, we can expect facility costs to increase – which will increase medical costs.

You can register for WCRI’s  webinar highlighting findings from this year’s report here….tune in November 16, 2023 @ 2 pm eastern.

What does this mean for you?

It is long past time to start preparing for higher medical spend.


Oct
31

Work comp bill review – the state of the industry

Over the last two decades work comp bill review has A) changed a lot and B) remained stagnant.

Both things are true…

Here’s the top takeaways from our just-released Survey of Workers’ Comp Bill Review (public version is available here; respondents received a much more detailed version).

Top findings are as follows (scores are 1 – 5, with 5 being highest):

  1. The BR industry’s overall rating from 2018 hasn’t changed, with an overall average grade of 3.2.
  2. Today there’s almost no differentiation in ratings across the major vendors; scoring has become more compressed since 2018.
  3. Customer service is of utmost importance in establishing a successful BR relationship. It is the primary reason respondents gave for changing vendors.
  4. There is a noticeable difference between executives and front-line employees in the evaluation of their BR vendor’s customer service. Front-line employees’ average score was 3.6, while executives scored 4.2.
  5. Automation is a hot topic in the industry, with a focus on improving turnaround time, auto-adjudication, and quality. However, some respondents are still looking for their BR vendor to better handle basic tasks.
  6. E-billing is gaining popularity, particularly among larger respondents and those who handle BR internally.

Couple deeper dives.

As noted above the survey included both front-line staff and management respondents; it won’t surprise many readers to learn front-line folks are not as satisfied with their BR vendor as their titular superiors are...that’s because execs value “savings” (which are mostly ephemeral as they are just reductions below some arbitrary benchmark, not actual medical cost reductions) – while front-line workers value efficiency, simplicity, clarity and quick problem resolution. 

Since execs make buying decisions, vendors mostly focus on what I would argue are often meaningless metrics. (don’t get me started on reductions below billed charges…)

More broadly, since our first BR Survey way back in 2009:

  • there’s been major consolidation…there were more than 11 vendors back then (remember Stratacare?  CS Stars? CompReview? Ingenix?) and market share was pretty spread out. Today, the number of vendors hasn’t shrunk much, but market share is much more concentrated. 
  • BR vendors have yet to embrace real payment integrity tools. There’s way too much “we know what we are doing” and way too little “we can always get. better”. The arrogance of ignorance is nowhere more entrenched than among BR company execs (not all, but almost all).
    And that, dear reader, is because buyers aren’t pushing vendors hard enough.
    That is NOT to say some payment integrity vendors aren’t at fault; they are too rigid in their pricing or workflow requirements, just too hard to work with.

What does this mean for you?

Buyers – push harder.

BR companies – you can do better.  A LOT better.