Here’s what else was happening last week while we were tracking One Call’s financial troubles…
Who’s for Medicare For All? Who wants to “abolish private health insurance in favor of a public run plan?”
That was the question asked of the 20 (!) Democratic candidates for President at last week’s debate with the request that those in favor raise their hands.
While it was great to see politicians put on the spot, forced to give a “yes or no” answer, the reality is it’s not that simple: There are multiple and quite different versions of “MFA”, ranging from Sanders’ version which is the “no cost to consumers, covers everyone, administered by the Feds, paid for with a big tax increase” to others’ “you can buy into Medicare if you want or keep your employer-based coverage.”
When someone tells you Candidate X wants to do away with your health insurance, make sure that someone knows what they are talking about. Ask them to define exactly what Candidate X’s platform is, then fact check with Google.
Here’s a great side-by-side analysis of all the health reform bills now under consideration. Lots of nuance here…
Provider consolidation – costs and benefits
The California Health Care Foundation published a solid analysis of the implications costs and possible benefits of provider consolidation.
The net – costs go up, quality of care doesn’t.
Key takeaways include:
- A study of US hospitals by Stanford University researchers found that “hospital ownership of physician practices leads to higher prices and higher levels of hospital spending.”
- vertical integration increases hospitals’ bargaining power with insurers.
- Physician groups owned by large hospital systems were more than 50% more expensive than those owned exclusively by physicians, and
- “Physician-hospital integration did not improve the quality of care for the overwhelming majority of [quality] measures,”
Drug pricing
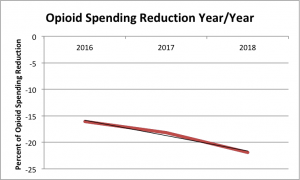
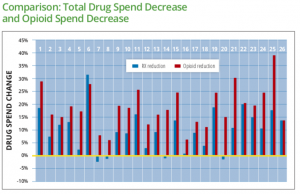
Thanks to WCRI for sharing their Flash Report on Drug Trends. The researchers looked at very recent data from 27 states; key takeaways include:
- compound utilization has fallen off a cliff
- opioid spend dropped in every one of the 27 states
- Louisiana’s opioid spend topped all study states at $100 per claim per quarter
- total drug spend also decreased in 25 of the 27 states.
A brief video intro is available here. And, the findings parallel what I’m hearing from respondents to our latest PBM in WC Survey.
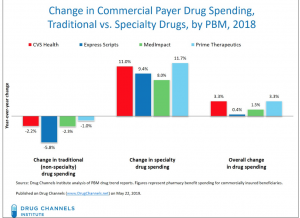
Next up, another excellent piece from Adam Fein on spread pricing and rebates.
Dr Fein opines that spread pricing – the PBM makes its money on the difference between what it pays the pharmacy and what it charges the payer – isn’t necessarily a bad thing. He also discusses how some manufacturers use rebate payments as a way to force buyers to use their drugs.
head’s up – I’m about halfway thru the 16th (or is it 17th?) “Annual survey of pharmacy benefit management in workers’ comp”; pricing is a hot topic, but the respondents’ views are not what I expected. More on this next week…
Worker mis-classification
Excellent piece in WorkCompCentral about the ongoing effort to combat the real fraud in comp – sleazy employers, employee leasing companies, and labor brokers that lie to avoid paying workers’ comp premiums.
The piece reviews research by Harvard University’s Law School; the research was triggered by:
the USDOL [Department of Labor]…rolling back worker protections in a variety of ways, initially withdrawing a WHD Administrative Interpretation on misclassification, and piloting an amnesty program for wage and hour violators, called the PAID program. As a result of this retreat at the federal level, state enforcement has become more critical than ever.
The entire report is here; the takeaway [emphasis added] is:
“Misclassification and payroll fraud harm workers, depriving them of rights and protections to which they are legally entitled. Law abiding businesses also suffer, as they struggle to compete with companies that unlawfully lower their costs”
Have a great holiday week, enjoy friends and family, and get out and away from work.
I am!


 I’d encourage all to read Dr Fein’s post – and to subscribe to