Aug
17

The Opioid Update

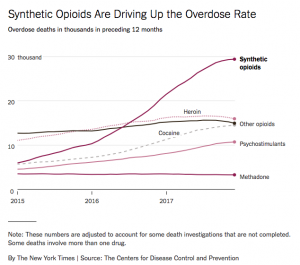
72,000 kids, moms, dads, brothers, sisters, best friends died last year from opioid overdoses.

Things are so bad that despite the ever-climbing death toll, news reports announcing the butcher’s bill manage to sound somewhat positive, citing reductions in deaths in a handful of states. Meanwhile, between 2.1 and 4 million Americans suffer from Opioid Abuse Disorder. 

Fentanyl is now the biggest driver, accelerating a years-long upward trend begun by rampant over-prescribing of prescription opioids.

Researchers cite some reasons for optimism; death rates in the west remain pretty flat – likely because the heroin used there is hard to mix with fentanyl…however there’s evidence that the black tar folks are figuring out how to do just that.

Meanwhile, Congress dithers; debating, pontificating, speechifying – and doing precious little.

To date, they’ve allocated a mere billion dollars to the biggest health crisis we’ve seen in decades.

Here in workers’ comp land, CWCI just released an analysis of polypharmacy among work comp patients in California. (Polypharmcy refers to patients getting multiple drugs.)

Two key takeaways:

  • A combination of  opioids, muscle relaxants, and anti-inflammatories was the most common drug cocktail. (opioids combined with muscle relaxants are very, very dangerous)
  • Shockingly, fully one-fifth of patients prescribed 3 or more drugs have back strains without skeletal involvement. Another tenth have various other sprains.  Yup, strains and sprains account for about a third of these patients.

What does this mean for you?

The next time someone protests the UR/IMR process, ask them how many more patients have to die from opioids before they accept that doctors need oversight.


Jul
27

Friday catch-up

I thought summer was supposed to be slow…

Sorry for lack of posts last two weeks – just slammed with client work.

here’s what I should have been posting on.

Economy drives employment drives workers comp

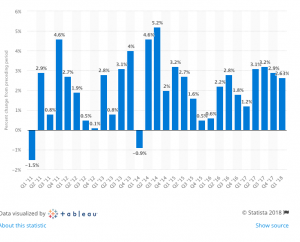
The economy boomed in the last quarter, with growth around 4 percent, a number we haven’t seen for four years.

Chart from Statista.

That’s the headline; the real story is less positive. Growth was partially driven by:

Here’s hoping things continue without overheating; forecasts aren’t so positive.

Implications – Lots of jobs open means higher wages and incentives for employers to keep workers on the job and get them back to work ASAP.

For those who just can’t get enough of the tariff issue – here’s the Harvard Business Review’s historical perspective.  Yes, I am a nerd.

Heat = more work-related illnesses/injuries

Deadly fires in Yosemite and California and Greece and Siberia and Sweden. A heat emergency in Japan. Temps in LA at record levels – even overnight. Scorching temperatures here in upstate New York.

Yes, climate change is happening. Yes, humans are the cause. And yes, it’s going to impact workers.

If the wet-bulb temperature (equivalent to that recorded by a thermometer wrapped in a moist towel) exceeds 35°C [95 degrees Fahrenheit], even a fit, healthy youngster lounging naked in the shade next to a fan could die in six hours.

Shifts in weather patterns are far more significant than overall global warming as they lead to very hot and dry conditions some places, hot and wet others, and exacerbate storm intensity among other effects.

Kudos to NCCI – they’ve been producing some highly relevant, much needed, and very useful research of late. Detailed, thorough, and diverse, and well worth your careful review.

One different angle is their ongoing work to highlight the good done by the  workers comp industry every day. Today’s installment is another example of this; there’s a lot more recognition that work comp is about the patients and employers.

Well done.

Opioids in the Federal workforce

Thanks to the great folks who handle my social media, website, and all that technical stuff I don’t understand at all, we’ve got video of testimony before the House Committee on Education and the Workforce.


Jul
23

Sloooooow progress in California’s work comp system

That’s the quick takeaway from a review of CWCI’s just-published report on drug prescription management in the Golden State. (there’s a lot more to this study than this…)

As cognoscenti (a fancy word for nerds) know, the utilization review (UR) and Independent Medical Review (IMR) processes were intended to help ensure patients got the drugs they needed quickly, were protected from dangerous or potentially unsafe drugs, and prescribers would learn what was likely to fly and what wasn’t.

This last was based on decades of experience in healthcare, observing what happens when evidence-based guidelines protected by utilization review processes to encourage/require compliance are put into place. In most every other instance, providers adapted their care models to meet the standards, and after a flurry of appeals at the outset, things settled down a lot.

But, well, hey, this is workers’ comp…

The first two (better care and patient safety) seem to have worked pretty well, but up till now, it appeared that WC prescribers were militant non-learners as the volume and type of UR/IMR requests just didn’t taper off.

My assessment of CWCI’s report is (equivocation alert) prescribers MAY BE changing their behavior – a wee bit. 

Here’s what’s driving my optimistic take (from CWCI):

After the formulary took effect last January, prescription drug requests declined from 44.5 percent to 40.7 percent of all UR decisions in the study sample – a relative decline of 8.5 percent.

I mean, how could one not dance in jubilation, right?

Well, perhaps prescribers have decided to not keep pushing that stone up the hill. Or perhaps it’s just a temporary hiatus.

I’m going to remain optimistic, and you should read the entire report because there’s lots of good info in it.

What does this mean for you?

Less hassle, better care. We hope.


Jul
13

Friday catch-up – Hospitals and a BS alert

Glorious week here in New York’s Finger Lakes – high 70s, lots of sun, nice breeze.  I know, Florida friends, you’ll be gloating in February when it’s 10 below and snowing sideways…

Hospitals

NCCI’s just-released research indicates facility costs are rising, driven at least in part by less competition among hospitals. Key takeaway:

Reductions in hospital operating costs do not translate into price decreases. Research to date shows that hospital mergers increase the average price of hospital services by 6%−18%.

Kudos to NCCI for this research and the piece itself. The article is very well-written, concise, and understandable for us laypersons. NCCI has upped its game considerably of late, producing excellent work and explaining what their findings and implications thereof.

I’m going to focus on this in a post next week – there’s a ton of insights here that demand careful consideration from payers and employers.

For those looking to better understand how hospitals set prices, determine what their actual costs are, and how they use data to reduce costs while improving care, read this piece in HealthAffairs.

And there’s this – a hospital in the Cayman Islands is delivering excellent care at a fraction of the cost of US facilities. The facility is fully accredited, provides a simple, bundled price for each procedure (instead of bills for each doctor, facility fee, procedure, implant…) and will be a very attractive option for many Americans with specific health needs.

Medicaid

My bullshit detector went nuts when a press release hit the inbox this week.

In what has to be one of the crappiest, most distorted, unscientific and biased pieces of “research” ever done, a so-called “non-partisan” entity calling itself one of the nation’s “leading public policy organizations” claims:

in some states, up to 70% of able-bodied adults enrolled in Obamacare expansion earned $0 in income

I’m going to dig into this steaming pile of nonsense next week, but for now, know that this is flat out wrong.  There are so many errors, distortions, flat-out wrong statements, conflations, and unsupported conclusions in this “research” it just boggles the mind.

It’s one thing to have principled disagreements on policy. It’s entirely another thing to lie your ass off.

For those interested in real research by unbiased experts, the Kaiser Family Foundation’s recent report on Medicaid Work Requirements is required reading.

OK, rant over – till next week.


Jul
11

A billion dollars and better care

Work comp drug costs have dropped by over a billion dollars over the last eight years.

What’s even better news is this has been driven largely by sharply lower opioid utilization.

The bad news is there are still far too many patients suffering from Opioid Abuse Disorder brought on by massive overprescription of opioids.

Across all 29 workers’ comp payers surveyed by CompPharma, drug costs dropped almost 10 percent last year compared to 2016. (Total US drug costs decreased last year by 2.1 percent)

The results come from our annual Survey of Prescription Drug Management in Workers’ Comp, a project now in its fifteenth year.

Payers cited clinical programs as the primary driver of lower opioid and total drug spend. A key takeaway come from payers’ views of formularies:

many respondents did NOT want to abandon their internal formularies in favor of a one-size-fits-all blanket formulary. These payers noted patients are all different, their needs evolve throughout the course of treatment and recovery, and therefore their pharmacy needs would change as well. While they were in favor of managed (state-mandated) formularies for initial fills, they want flexibility to adapt to the patient’s condition and needs without putting undue burden on the prescriber and pharmacy to comply with prior authorization requirements.

The public version of the Survey Report is available here for download; respondents received a more detailed version of the Report.

As the author of the Survey, I’d be remiss if I didn’t thank the respondents who have provided data and their views and opinions over the last 15 years. Their willingness to share their insights and perspectives has gone a long way to helping improve patient care.

I’d also note that work comp Pharmacy Benefit Managers have been largely responsible for reducing employer’s drug costs and opioid overuse. Another way to put this – PBMs have dramatically reduced their revenues by improving their customers’ and patients results.


May
23

Hartwig on the economy and workers’ comp

Dr Bob Hartwig of the University of South Carolina gave his annual whirlwind tour of all things economic. The net – his talk was an exuberant paean to the US economy – and the impact of that economy on workers comp.

My view –

  • the data doesn’t indicate the economy has noticeably strengthened over the last year or so;
  • consumer and small business confidence levels are notoriously fickle; and
  • there are lots of warning signs out there that merit close attention; warning signs that weren’t adequately addressed in the talk.

While he briefly noted several potential issues with the economy, overall Bob painted a picture of businesses investing, consumers spending, profits abounding, and sunshine and happiness all around.

I’m not so sure.

For example, he cited as one reason for the nation’s positivity this datapoint; GDP growth was north of 3 percent for two quarters last year. Well, that’s true. However…

He chose two quarters where growth was over 3 percent – but in reality annual growth was 2.6% last year.

And 2.3 percent for the first quarter of 2018.

And last year’s 2 quarters paled in comparison to the 3.5 percent growth in 4 out of 5 quarters we saw in 2013-2014.
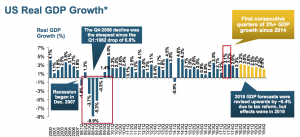
A 2.6 percent annual increase is solid, but by no means a boom.  Bob did cite the high consumer confidence index, small business confidence, and a variety of other factors as support for his overall very positive outlook.

While people may be “confident”, confidence is a state of mind that can change really quickly…and there are dark clouds on the horizon.

For example – wages remain low; consumer debt levels are at historic highs (26% of earnings); the Federal debt and deficit is going to soar, driving up interest rates; and there’s a real risk of trade wars.

If consumers feel strapped and stop buying, things will get ugly. Given the record levels of consumer debt, I don’t see how the buying surge can keep going unless wages increase and interest rates stay low – which isn’t happening.

Bob briefly noted the issue of wage stagnation, but did not discuss the impact of this – and the fact that this is a chronic problem for consumers and businesses. In fact, the financial gains are not going to workers, but to investors and owners…who are less likely to use their newly-gotten tax gains and profits to buy pickups and groceries and movie tickets.

He talked about job openings, specifically the 6 million job openings today – perhaps those jobs are open because employers aren’t willing to pay enough to get people who have left the workforce back in the job market.

He did address the the long-term unemployed, sort of.  Hartwig stated that the number of folks not looking for work is not going to change due to a number of factors (citing the U-6 unemployment rate, which includes those not actively looking for work – slide 17).

Got to admit this was confusing… the overall labor force participation rate, which has been pretty flat since 2014, was often cited by Obama critics as proof that the “recovery” was no recovery at all.  Now we hear that the unemployment rate – which is the inverse of the labor force participation rate – isn’t likely to change. [I emailed Dr Hartwig Monday asking for clarification; haven’t heard back yet but will update the post if I do]

Well, which one is it – will people return to the workforce or not?
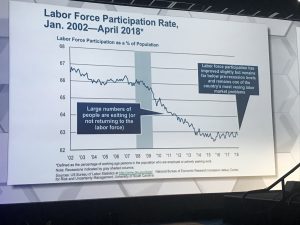
Here’s a detailed discussion of labor force participation rates; note that the rate today is exactly what it was in January 2017 – 62.9%. And here’s why labor force participation is viewed as a better measure than unemployment.  Here too.

Clouds on the horizon

Hartwig did note a few potential issues…

  • the possibility of trade wars affecting employment; those industries most at risk – aircraft, electrical equipment, fabricated metals are among the top potential victims,
  • infrastructure improvements likely won’t have much of an effect.
  • the pending huge increase in the Federal debt  – Bob said that interest rates “may” have to increase.

May???

Not only will interest rates go up (for businesses and the Feds), but a much larger percentage of Federal spending will go to debt service. In fact, we can expect the Fed to increase rates this year.

What does this mean for you?

The data points cited by Dr Hartwig don’t indicate the economy has strengthened appreciably over the last 18 months. Yes, consumer and small business confidence indicators are strong, but they appear to be based not on real economic conditions but on emotion.

Emotions can change fast.

May
22

Swedlow on work comp networks…they are NOT equal

The best was saved for last at NCCI’s Annual Issues Symposium. After Gen (ret) Colin Powell warmed up the crowd, NCCI’s Barry Lipton and CWCI’s Alex Swedlow took to the stage to educate us on networks and outcomes.

First, California. Average medical costs have gone up 4.3x in CA since 1990; while there have been lots of regulatory and legislative efforts to add guidelines, enable managed care, and increase network usage, ultimate medical costs now are over $37k.

Network penetration in CA is now around 84% for physician services – where it looks like it has peaked.  Along with this increase has come an increase in administrative expenses.  WC Admin expense in CA now accounts for 53% of work comp costs, more than twice the average across the nation.

41% of those costs are for med management (31% for defense attorney expense). Bill review and network account for 47% of those medical management costs, UR is the remainder. (these percentages have been pretty static over the last decade).

So, what are you getting for all your millions?

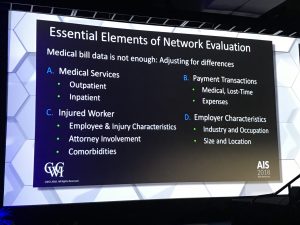
Fortunately, CWCI’s done a lot of work to evaluate that very question. And they dug really deep. The slide below describes the data points CWCI used in their network evaluation.

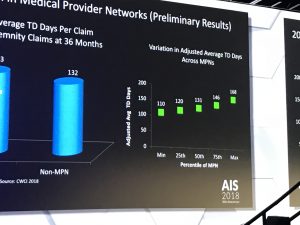
Swedlow et al then looked at individual networks, comparing 11 different networks’ outcomes for claims (case mix adjusted, incurred between 2011-2014, developed thru 2017). Lots of takeways that will be published in a few weeks after final editing.

But here’s a spoiler –

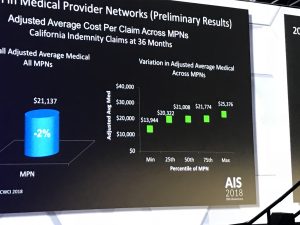
There’s a huge amount of variation between networks, and some are delivering excellent results while others are worse than no network at all.   I direct your attention to the right side of the picture; note that average case-mix-adjusted cost per claim varied by 82 percent.

If you used the MPNs on the left side of the graph, your medical loss costs per claim would be over $11,000 lower than if you used the MPNs on the right.

And, your patients would get back to work two months earlier.

My takeaway is this – there are two types of MPNs; the State Fund and Kaiser Permanente On-The-Job type that is outcome-based, highly selective, and focused on care. This Outcome-based MPN, Or O-MPN is on the left of the screen.

And the revenue-based, that are focused on generating dollars off savings below fee schedule and other meaningless standards. On the right of the screen, the revenue-based MPN, or R-MPN, is huge, includes every provider in the book and some who haven’t been in the book for some time, is completely unmanaged, and generates beaucoup bucks for the payers that use it.

Lots of other great insights in the session which I missed – I had to run to get to the airport.

What does this mean for you?

Depends…Is your MPN an R-MPN or an O-MPN?  


May
18

Blockchain’s getting more real in work comp

Kudos to NCCI for including an excellent discussion of blockchain in this year’s Annual Issues Symposium.

(Prior posts on blockchain are here.)

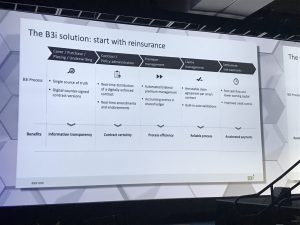
This is starting with reinsurance; a good summary is in presenter Paul Meeusen’s summary slide below.

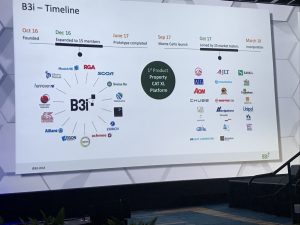
Meeusen and his colleagues and business partners have moved very, very quickly. Many of the bigger names in insurance, reinsurance, and other service entities came together in December 2016 to figure out if and how to work together on blockchain.

Now, less than 18 months later, a company is working to set standards, coordinate communications, and define working processes.

Rather than get into the nits of this, I’ll focus on impact.

Remember – P&C insurance’s administrative expense load is stupid high.

And work comp is perhaps the worst offender; about 30% of premiums go to stuff other than paying claims. That administrative expense is, in the view of blockchain advocates, proof that WC is very inefficient. Therefore there is a significant opportunity to strip out costs while improving data quality, speeding up transactions, and reducing employers’ and taxpayers’ expenses.

The business case for blockchain – which I’m using here as a description of a broader use of technology to replace today’s cumbersome, error-prone, and high-friction administrative system – is so compelling as to render it inevitable.

It also means there are going to be a LOT more opportunities for consumers to insure things that are valuable to them – objects, events, structures, trips, you name it.

What this means for you:

  • Many of us who are “frictional cost” are going to lose our jobs.
  • Service companies who make their money doing admin work are going to lose their customers.
  • And other vendors, especially small ones who can’t afford to adapt to blockchain, are going to find they can’t service their customers.
  • But there are great opportunities for creative insurers to find new niches to service customers.


May
17

Opioids, marijuana, pain, and workers’ comp

NCCI’s Raji Chadarevian discussed opioid utilization, price, and cost at NCCI’s AIS 2018.

6 percent of opioid medications used in workers’ comp is for treating opioid use disorder; methadone and suboxone are the drugs of choice.

The older the claim is, the more opioids are prescribed. For 15 year old claims, about 2.5 oxycodone pills were prescribed per day. As a result, claims that are more than 10 years old accounted for more than 50% of all oxycodone pills. And, the top 10% of users consumed 79% of pills.

Those heavy users also get a lot of other medications to help them deal with side effects of opioids (and other conditions). These users get about 7 non-opioid scripts for every 10 opioid scripts.  These drugs include gabapentin, benzos, and muscle relaxants.  Fortunately, Raji reported that there’s been a change over time as prescribers have shifted to non-benzo anticonvulsants and made other changes to reduce health risks.

Raji handed the mic off to Dr David Deitz (good friend and colleague). Dr Deitz gave a trenchant and informative description of marijuana, noting that way more is not known about marijuana’s (and its included compounds’) effects on humans than we do know. Some of the effects are reduced anxiety, reduced inflammation, euphoria, appetite stimulation and others you may have experienced yourself.

Dr Deitz then reviewed the state of the science on cannabis – there is substantial evidence of benefit for the treatment of chronic pain and the treatment of nausea due to chemotherapy.  Moderate benefit for anxiety, sleep loss, and appetite/weight loss due to HIV/AIDS has been found.

Evidently there are a lot of restrictions on research into marijuana by the FDA – some seem nonsensical.  These restrictions are screwing up research, and perhaps leading to wrong conclusions.

For work comp, cannabis may be useful as an adjunct, or secondary treatment for:

  • Chronic pain
  • Anxiety
  • Spasticity related to spinal cord injuries

Couple other key points.

Opioid mortality and the use of opioids for Medicare and Medicaid patients both declined in states with legalized use of marijuana.

58% of voters support legalization of marijuana, and 70% oppose enforcement of federal laws in states that have legalized marijuana.

The net – we don’t know much about cannabis, but we do know it absolutely helps in certain conditions, and most folks want it legalized.


May
17

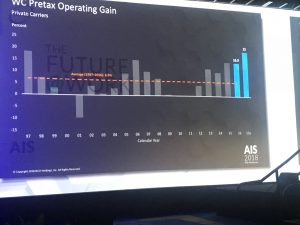
That’s the first top takeaway from NCCI’s Annual Issues Symposium.  Over the last 30 years the average pretax operating gain has averaged 5.5%; last year the return was more than four times higher.


The big news came from Kathy Antonello, NCCI’s Chief Actuary. (the bullets below are derived from different data, complete presentation is here). Note “NCCI states” does not include several large states; California, New York, Pennsylvania, Ohio, and others.

  • Claim frequency dropped precipitously – 6 percent, on top of last year’s 6.2%…over the last 20 years, frequency drops 3.7% per year (for carriers and state funds in NCCI states).  According to Antonello, “barring major unforeseen events, we do not expect this trend to change.” (I may have slightly misquoted her) Private carriers’ work comp premiums declined marginally…adding State Fund premiums still resulted in a marginal decrease.
  • WC combined ratio for private carriers improved to 89 – the lowest result in over 50 years.  That is a pretty amazing number.
  • Two big states – FL and NY – saw premium increases north of 9% (rates are available for all states)
  • Medical inflation for lost time claims increased 4 percent for funds and carriers in NCCI states.

A couple underlying stats reveal much more.

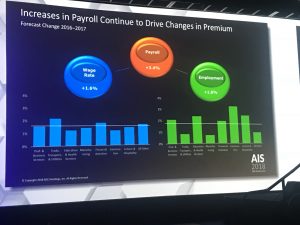
Comp premiums are driven by payroll and losses; payroll jumped 4.4 percent, while loss costs dropped by 4.2%. So, despite more pay to more workers, losses stayed flat.

Put another way, the frequency decline more than offsets increases in employment. So, the total number of claims likely declined significantly.

The result – filed premiums in the vast majority of states decreased last year, so most employers’ costs are decreasing. And, this may continue, as reserves are in very good shape, so insurers won’t have to raise rates in future years to build up reserves for past claims.

Finally, Kathy’s presentation was terrific. Great use of graphics, videos, and slides to communicate some pretty complicated and dense information. Kudos to the folks behind the scenes who developed the data, put together the graphics, and made it all understandable.

I’ll give my take on what this means next week; suffice it to say that this is:

  • great news for employers and taxpayers,
  • bad news for case management and other claims-centric businesses, and
  • going to force insurers to think very carefully about future capital investments.

There is a wealth of information in the presentation, SSDI and work comp, residual markets, BLS v WC claim rates – download it here.