A few possible contributors –
- more providers than average – which creates demand,
- facility costs – and declining quality – due to significant healthcare system consolidation,
- attorney fees driven in large part by regulatory enablement,
- creative providers looking to suck dollars out of taxpayers and employers’ pockets, and
- the actions of a handful of providers seeking to crash the medical management process.
California has 380 physicians per 100,000 population, whereas the US has 295 per 100,000 – that’s many more docs looking to do many more procedures on the same number of patients. Unlike market-driven businesses, in healthcare supply creates its own demand.
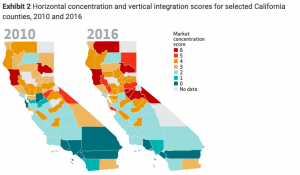
The lower the number above, the fewer health systems competing for business
60 percent of healthcare markets in California are highly concentrated, so the dominant provider systems have much more pricing power – which leads to higher health insurance premiums – than in days past. According to HealthAffairs:
the estimated impact of the increase in vertical integration from 2013 to 2016 in highly concentrated hospital markets was found to be associated with a 12 percent increase in Marketplace premiums. For physician outpatient services, the increase in vertical integration was also associated with a 9 percent increase in specialist prices and a 5 percent increase in primary care prices.
If health systems can jack up prices to giant group health insurers by 12 percent, imagine what they are doing to work comp payers – who represent perhaps 2 percent of their total business.
Unlike most other states, plaintiff attorneys are compensated for a seemingly endless variety of filings, medical management disputes, disagreements, hearings, UR and IMR disputes.
As reported by CWCI in last week’s annual meeting, Texas had 1506 dispute letters, while California had over 180,000. Texas saw a decline over time as providers realized that no matter how many times they asked to get a specific procedure authorized, the answer was consistently no.
Not so in California, where the same providers keep flooding the system with appeals for the same stuff, knowing full well they will be rejected.
The good news is several of last year’s top IMR appellants are no longer in the top 10, as they’re no longer allowed to deliver medical care.
What does this mean for you?
Attorneys get paid to dispute the higher volume of services prescribed by a larger number of providers employed by healthcare systems that have a lot more pricing power.

Joe, Great overview, I can add one more “cost” to our system. Apparently “music teacher” is a qualification to be a work comp advisory judge in California. (at least music teachers that went to school with the governor) One can only imagine the kinds of decisions that get made. No wonder claimants attorney’s keep testing the same issues..
Hi Joe,
I agree about facility costs, attorney behavior, and abuse of the system by a small number of medical providers, but there are some other issues worth discussing which I believe could be easily fixed.
Here’s my two-cents view from the provider’s perspective in diagnostics and physical therapy…
Almost 30% of medical spend is in these 2 important areas, yet, despite an already low state fee schedule, many of these providers often receive as little as 50% of the “medical fees” paid by payers and employers. The difference goes to middlemen networks as large profits. Providers HATE this system. Such low pay results in cutting corners in quality of care, adds to unnecessary scheduling delays and leads to over utilization of services. How about just paying providers fairly so they can deliver top quality, efficient care?
In addition, where there is an excess of providers in these medical areas, there is more wholesale price competition to get referrals, which further lowers what providers get paid. In this situation, the networks reap even larger profits because they maintain the same retail rate charged to their payer clients. Higher profits, but no passed through savings in comp costs.
Would love to hear others’ comments.
Hello Dick – thanks for the comment. Couple questions/observations.
1. Can you provide a cite or source for the almost 30% of spend is in imaging and PT? That’s much higher than I’ve seen; the 2016 WCIRB report indicates payments to physical therapists accounted for 6% of spend in Q4 2015; WCRI’s 2018 Compscope report indicates payments to PT/OT providers accounted for 14.1% of medical spend in 2016/17 for claims with >7 days of lost time (a different metric with smaller sample size). Imaging, described as minor and major radiology, accounted for 5.2% of total spend for both facility and non-facility providers. Thus the total appears to be 19.3%. If I’m missing something here please let me know.
2. You state that “difference goes to middlemen networks as large profits.” Employers, taxpayers, and insurers get the bulk of the reduction below fee schedule, not the “middlemen networks”. You also assert that in high-PT-density areas, networks somehow make more profit as they don’t pass savings along to payers. What is the basis for that assertion?
3. You claim that this “low pay” results in all manner of bad behavior – yet outcomes as measured by the research organizations cited above don’t indicate there’s been a wholesale deterioration in results; in fact things seem to have improved. WCRI’s CompScope report is especially useful in this assessment. If you have other information please share.
At the end of the day, providers are free to decide to join networks or not. If these “middlemen” are delivering worse results and keeping the majority of the dollars for themselves, providers should find great success by creating their own alternative networks and competing.
Hi Joe, I’m glad to respond to your questions…
1. My “30%” source is the 2017 State of the System Report from WCIRB, which showed the following % of physicians medical services for the year 2016: 9% for Radiology and 20% for PT. Plus, note that Diagnostics also includes Electrodiagnostics, which is not even part of that total and would result in an even higher figure.
2. I disagree with your comment that “employers… get the bulk of reduction below fee schedule, not the middlemen networks.” This is an easy one to prove by simply looking at bill review data for Diagnostics and PT (which shows, for each billed medical service, what is billed, the OMFS amount, and what is paid by the payer). Then, ask each medical provider listed on the bill review report the amount they received from the network for performing those services. Numbers don’t lie. The payer gets a small % of savings relative to the amount kept as profit margin by the network.
Re: High-density PT areas, just ask providers for their contracted network rates. All other things being equal, where providers have excess capacity and where there is more local competition, wholesale-negotiated rates tend to be lower… which translates into higher network profits because such lower rates are NOT shared with the payer. I have done this research throughout California.
3. My comments were based on research presented at AIS 2018 by NCCI and CWCI evaluating the impact of provider networks on work comp costs. Those MPNs that focused on provider unit discounts (low pay) – instead of focusing on quality and speed of care – had HIGHER total medical costs and HIGHER TD days (more indemnity payments). Most providers know the reason: you often get what you pay for when provider pay is too low.
Finally, many providers are not really free to decide to join networks to get referrals because the shear size and clout of some of those middlemen networks creates too much control over patient referrals and prices vs. the small size of most PT practices. The best solution is not to create alternative networks, but rather to prohibit all reselling of medical services for a profit (as does Medicare) and to require full price transparency.
I welcome further comments from you and all your readers. Thanks for bringing up the issues.
Dick – couple clarifications.
1. I’m afraid you misread WCIRB’s report. The relevant data is on chart 10; the percentages you cite are as a percentage of PHYSICIAN spend, not total medical spend. The dollars for imaging were $100 million, and $200 million for PT. Total actual medical costs were about $2.1 billion, so PT was about 9% of spend, and imaging 4.5%.
https://www.wcirb.com/sites/default/files/documents/2017_state_of_the_california_workers_compensation_system.pdf
2. I don’t follow your logic on calculating employers’ savings as you are missing a critical data point. The methodology you reference doesn’t reveal the employer’s network cost amount so you can’t draw any conclusions about employers’ retention of savings. It follows that since you do not know what employers pay, you cannot make any statements about how much networks keep.
3. I’m quite familiar with the research you mention about MPNs, but don’t see how you can generalize overall results to the specific niches of PT and Dx. If you have data/research specific to those categories please share.
Hi Joe,
One last round of comments on this topic…
1. My recent comment clarified my language as “% of PHYSICIANS medical services for the year 2016: 9% for Radiology and 20% for PT,” as you correctly point out in your link. By the way, note that the category “inpatient and outpatient services” in your link also includes non-physician diagnostic and therapy costs that are not included in the “physician” category that represent additional facility/technical costs for such services.
2. I still don’t follow your logic that “you do not know what employers pay, so you cannot make statements about how much network keep.” We know. We do this all the time with employers by just looking at their bill review reports. It lists EXACTLY what they paid for a medical service. It also should list the fee schedule for that service. Just subtract the 2 and you get the employers savings off the fee schedule. Then ask the rendering provider what they got paid by the network and subtract that payment from the employers payment and you get the network’s profit margin. We also do that all the time. The results surprise most employers.
3. That’s the point of research… to generalize trends and apply them in daily practice. In my experience, it fits well. Ask employers if they believe paying provider low rates can harm care and prolong return-to-work?
Thanks for your comments. I hope others chime in. Have a great weekend.
Dick –
Thanks for clarifying your original figures re PT and Dx. The inpatient and outpatient services lines are reserved for facility-based charges, which don’t include the types of PT and Dx delivered by independent imaging facilities and PTs.
Are you saying you are reading bill review reports which indicate – on a line item basis – the data points you list above? Further, that the payers don’t get the majority of those savings? I’d love to see redacted reports.
That’s also the risk of interpreting research – that one inappropriately generalizes research and thus draws conclusions that are unsupported by the research itself.
Where we seem to have a disagreement is you think the networks make huge margins, whereas I do not. There are other entities generating margins off “discounts” including TPAs and insurers.
Joe, WCRI’s 2018 Compscope reports compares CA with 17 other states. the report says that the ave medical expense for a claims with at least 7 days lost time is 50% of the 18 state average, indemnity costs 182% higher, and “delivery expense” 146% higher. Defense attorneys are involved in 43% of these claims vs an 18 state ave of 15%. These 2018 figures are similar to other reports in the past of a very high litigation rate which leads to many more settlements. Any piece of evidence in favor of this is that CA’s utilization of Eval and Mgt is much higher as a percentage of total medical activity — 16% in CA vs. 6% for the 18 state average. A CWCI study some years ago showed that the litigation rate is far higher in southern CA vs northern CA, which itself is roughly similar to the national average. Thus, I think the weight of the evidence is in favor an explanation that focuses on litigation and claims mgt complexity.
In 2018, the maximum rate in California is $1,215.27 per week for total disability, while the minimum pay is $182.29.