I screwed up and I apologize.
Here’s what happened.
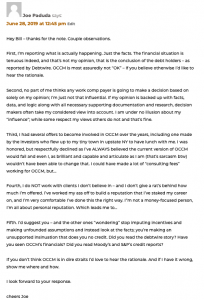
I failed to explain or provide context in my initial response to an anonymous comment on my post entitled “One Call’s doing great!“. Here’s the relevant comments:
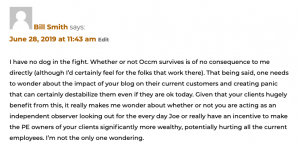
My initial response to “bill smith”:
“Bill” then sent in a response. I sent an email to the address he provided in the post,; the email bounced back indicating it was a fake email address. I checked the website he listed as his in his initial response; the website is the personal one of an African-American woman; she is dealing with Alzheimer’s. btw Ms Smith is a remarkable woman, handling this awful diagnosis with grace, wit, and elegance.
As “bill” was being disingenuous about who he was, i ignored his response.
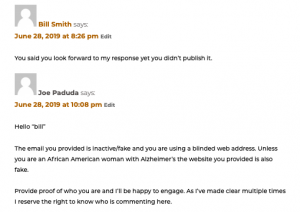
Next, he sent in another comment. “bill” was one of several anonymous commenters trolling me (and you), using fake emails and contact info. Getting tired of their antics and disgusted with their cowardice, I responded. The relevant conversation is below.
 Here’s where I should have been more clear. I should have posted the actual website address “bill” used in his original post so you, the reader, could see for yourself that what this troll was up to.
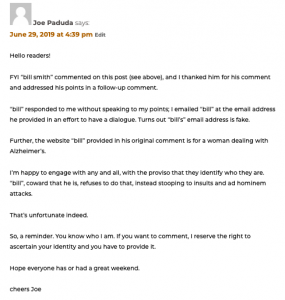
In what used to me normal times, this wouldn’t be a big deal as I detailed “bill’s” dishonesty in a subsequent comment![]() .
.
We aren’t living in “normal” times, and the casual reader may well have interpreted my response as a racist slur. I’m embarrassed by my mistake and apologize for it.
I’ll be more careful in the future.
As a reminder, here’s my policy on commenters…
This post was triggered by reader D. Gregerson who sent in a comment yesterday about this. I thank D. Gregerson for his comment.
Hey Joe! Great insight as usual. Keep them coming. I do have a question though. As I reviewed the comment section (which has now been closed) I noticed that you replied to someone saying:”unless you are an African American with Alzheimer’s, your website is fake”. Now, one would argue that the statement could be deemed inappropriate and demeaning. Especially considering that the topic at hand was One Call’s financial debacle. Care to expound?