Yesterday we focused on enrollment, and more specifically the change in the number and percentage of eligible Americans covered by health insurance.
In sum, about 9 million more non-elderly folks were insured earlier this year than were at the end of 2013; that means a decrease in the percentage of non-elderlies without insurance from 16.2% of the population to 10.7%.
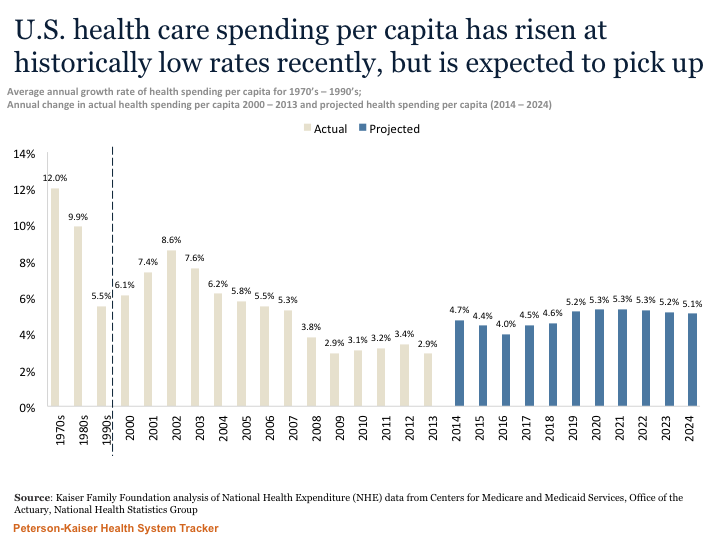
Today we’ll look at health care costs. One of the ACA’s goals was to reduce future medical costs; to be clear that does NOT mean costs in 2016 will be less than costs today, but rather cost inflation will be lower.
A bit of history is helpful here. I sold health insurance to employers a long time ago; when I could deliver a rate increase below 20%, I felt pretty good. Nowadays, rates are going up in the low teens for most individual coverage – but that’s just part of the picture. Let’s start with total health care costs – because we taxpayers fund Medicare and Medicaid as well as our own coverage.
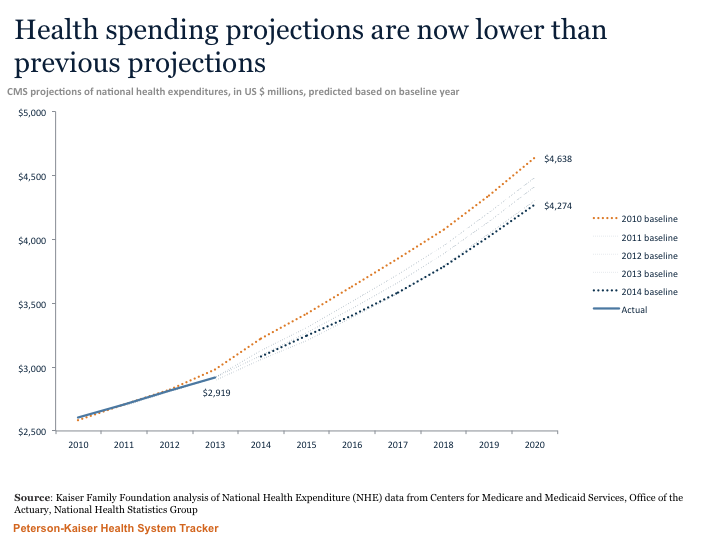
These are projections and as such are just that, however it is useful to compare them to past projections, which had overall medical inflation trending higher than this more recent forecast. (note the figures below are in billions of dollars, not millions)
Now, on to employer and individual costs. Let’s understand that ACA does have SOME impact on costs; added benefits, Exchange distribution, mandated coverage, and the demise of many Co-Ops thanks to the “Rubio Amendment” are repercussions that have yet to be fully felt.
For employers, the latest reports indicate increases of 6.6% (HMO plans) to 9.9% for PPOs for 2016. The primary drivers are prescription drug and hospital pricing; both are up substantially. Notably, Segal’s trend increase predictions have consistently been a couple points higher than the final results.
Finally, I’d note that shopping on the Exchanges can be quite beneficial. We switched from an Excellus Blues Gold plan to a Fidelis Platinum and cut our premiums by $50 a month and out of pocket expenses by several thousand dollars. Better coverage, way better health plan (Excellus screwed up our enrollment, billing, and coverage repeatedly), and less money.
What does this mean for you?
ACA looks to be moderating long-term trend rates overall. Total costs for 2015 are well under prediction and forecasts look good. That said, there are pockets of big increases – some of that due to the lack of competition.

Generally concur with these observations – but here are some concerns:
# Prescription drug costs – seeing future predictions in double digits
#Rural areas seeing huge problems with access and cost with many reports that doctors refusing Medicaid and exchange plan participants in rural areas and having to travel to urban areas for many specialty services
# Hospitals buying doctor groups – clearly driving up prices – at least so far
# The removal of annual and lifetime limits is understandable but recent anecdotal stories of some claims for catastrophic situations for more than $10 million per episode of care – these will drive up costs of insurance, stop loss, etc. These claims were unheard of with limits and probably were written off to charitable care.