A recently-released analysis of workers’ comp claim frequency tells us what we’ve known for years – the percentage of workers that gets hurt on the job has been and continues to drop.
Yet one major insurer indicates there are warning signs that frequency may be ticking back up, albeit in a tightly defined sector of the economy. More on that below.
There are many theories about why frequency has declined for decades – more automation, more emphasis on safety programs and loss control, less heavy industry here in the US, low investment in infrastructure leading to fewer jobs doing heavy construction. Many theories, but I have yet to see any credible research into exactly why frequency is declining.
This is one of those data points that is enormously important, yet it doesn’t get enough attention. So, here’s the skinny.
Claim frequency is a percentage – the number of injuries compared to premium dollars or FTE workers. Therefore the number of work comp claims is driven by the denominator; if premium or employment goes up, that can offset a decline in the percentage of claims.
But employment is about maxed out, so any changes in the percentage of claims will closely mirror the actual number of claims.
Another way to track the number of claims is to compare it to Federal data on the actual number of occupational injuries and illnesses. The graph below shows that the actual number of claims per 100 workers…
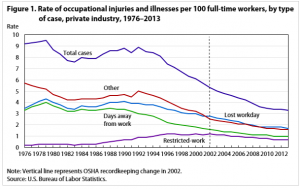
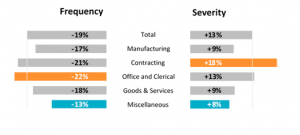
You’ve already figured out that the graph ends in 2013…so what about the intervening years? Fortunately NCCI provides ongoing research into just that here. When you dig deeper, we learn that total frequency dropped almost one-fifth from 2011 to 2016, led by office and clerical job classes.
As we learned at AIS in May, NCCI estimated frequency declined another 6 percent in 2017; the average decline over the last two decades has been 3.7 percent.
But.
Last week the Hartford announced it is seeing early indications of an uptick in claims volume. Chairman and CEO Chris Swift said [emphasis added]:
“workers’ compensation 2018 frequency trends are elevated from expectation…
our frequency in small commercial and middle market has turned positive this year. Based on our business and economic analysis, we view this trend as broader than just our book of business.…
Many businesses are struggling to find qualified employees and beginning to add more new workers to their payroll, generally increasing the risk of workplace injury versus what it would have been say a year or two ago.
Additionally, the tightening labor market produces more hours work for employee often resulting in fatigue and less training time compounding the risk of injury for the less experience workers.
Our uptick in frequency change has been moderate turning positive on a rolling 12-month basis. The actual frequency levels are now comparable to what we experienced in 2016 which is a very manageable shift in a book of business as large as ours.
The frequency increase is more pronounced among less tenured employees and it can be several times that of experienced workers.”
Notably, the Hartford attributed a 3.5% increase in Accident year combined ratio for its middle market business to this increase in frequency.
Couple of key points about this.
- The Hartford is the largest national seller of work com policies to small employers, and thus has the broadest lens.
- As a major writer, it also has lots of dollars to invest in business analytics – so it knows more faster than many insurers do. This from Hartford President Dough Elliott:
we have now installed a new claim platform over our 5,000 desk throughout claim. And the ability to access what I’ll call structured data and to slice and dice and be on top of it and to look at your metrics and watch your trends is much advanced from where we were five years ago. And so we have monthly and weekly discussions but we’re sitting on top of trends that candidly five years ago were very manual in nature to try to get our arms around and they were slower than we’d like to them to be.
What does this mean for you?
- This is not unexpected; we are close to max employment; small employers are desperate for workers and don’t have the time/expertise/resources to screen/train/protect those workers.
- Time to look at your data – closely.
- And likely time to dust off those underwriting, safety, and loss prevention manuals.

Work injury frequency is declining primarily due to better risk management practices overall. and work safety in particular. The declines reported by BLS are too comprehensive across most occupational sectors for the decline to be driven by additional suppression over past years. And industry shifting may account for no more than a third of the reduction. There are some businesses where reduction has been slow, such as agriculture, and types of injuries influenced by factors that may buck the trend — such as auto-related injuries. But the overall trend is down and will in my view continue.