Two messages from colleagues about yesterday’s claim frequency post add important nuance and depth to the issue.
First, thanks to WCRI CEO John Ruser PhD for his note with more current information on recordable data.
These data are critical as they are the only source I know of that records the actual injury numbers, or counts of occupational injuries and illnesses. Almost all other sources document percentages based on premium dollars or FTEs. While those are useful, service providers really want to know the actual number.
Ruser [emphasis added]
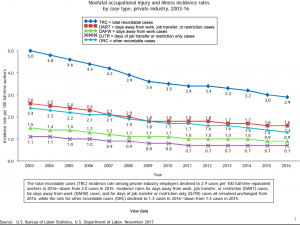
BLS has data through 2016 on its website (the chart book is easiest to digest and can be found here: https://www.bls.gov/iif/osch0060.pdf) The data show continued decline in OSHA-recordable rates through 2016, particularly among “other recordable cases.” BLS will release updated non-fatal injury data through 2017 on November 8.
I agree with you that credible research on why rates are declining is lacking. There simply aren’t good data to tease out the possible factors. Interestingly, shifts in hours worked away from high hazard industries does not explain the long decline in rates. The vast majority of industries are experiencing declines. I documented this in a paper I wrote for the American Journal of Industrial Medicine.
I’d emphasize John’s comment on high hazard industries. I’ve opined that fewer injuries in heavy manufacturing and construction were a likely contributor to the reductions in trend; thanks to John for correcting my error.
Next, from a former state workers’ comp director. [emphasis added]
as I look at chart provided in your blog today it took me back to the early days after the reform of XXXX. As can clearly be seen in the chart starting in 1992 the trend started down and has continued ever since. A lot of risk managers and safety staff took a lot of credit for those numbers as proof that they were doing a good job. I remember at the time thinking boy this looks really good but surely there is another explanation other than the [legislated] reform and all that we were doing in safety and I was right. Even after the… emphasis on safety [was reduced]…the number continued to go down. As I look back I was just in the right place at the right time. But when good things happen that can not be explained we tend to take credit for them…
This expert’s view is well worth repeating, perhaps best said by Tacitus:
victory is claimed by all, failure to one alone
What does this mean for you?
Claim counts are dropping – and will continue to do so. There is little “white space”, so growth for claims service companies will come from taking business from competitors.

Maybe I’m jaded, but due to a shrinking client base I’d expect growth will also come from providing unnecessary or elongated treatment to injured workers.
Jaded? Nope. Realistic.